Showing posts with label NZD/USD Forecast. Show all posts

Sunday, October 3, 2010

NZD/USD Weekly Technical Forecast (Oct 4-8 2010)


The calendar in New Zealand is rather light in the upcoming week, so the kiwi will mostly depend on the general mood. Nevertheless, there are still a couple of meaningful events. Here’s an outlook for the events in New Zealand, and an updated technical analysis for NZD/USD.

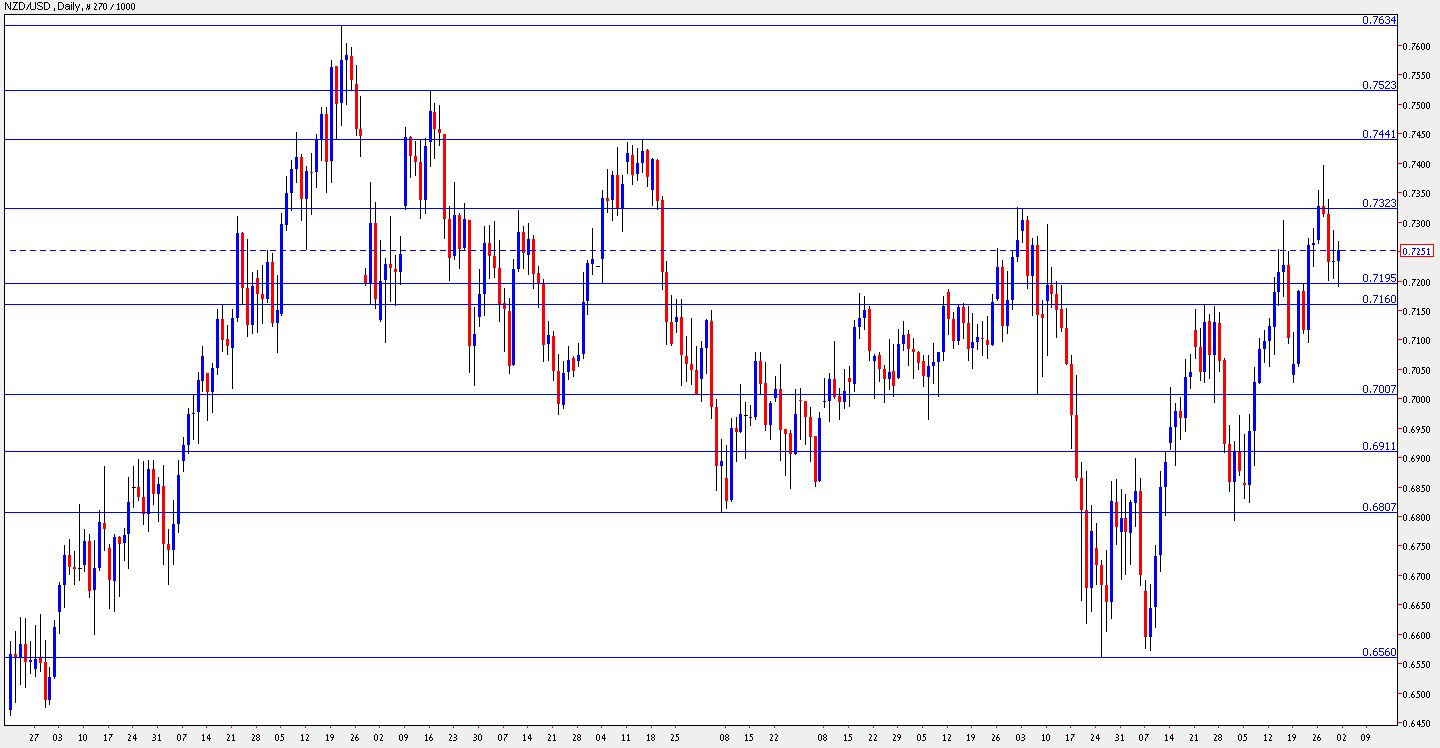
NZD/USD daily chart with support and resistance lines marked. Click to enlarge:

NZD USD Forecast October 4-8

The kiwi dollar enjoyed the greenback’s weakness, but fell short of the extraordinary gains seen with the Aussie. Will this continue?

  1. ANZ Commodity Prices: Monday, 2:00. As an exporter of commodities, New Zealand depends on commodity prices. In the past three months, commodity prices fell, with 1.4% last month. A rise is expected this time.

  2. NZIER Business Confidence: Monday, 21:00. This wide quarterly survey of 3500 businesses has a very strong impact on the kiwi. The figure has been positive in the past year, indicating optimism. On the other hand, the figure dropped from a peak of 36 points to 18 points. Another drop is due now, but still remaining in positive territory.


All times are GMT.

NZD/USD Technical Analysis

The kiwi had a rough time with the 0.7350 line before pushing up to the 0.74 region. A push towards the end of the week sent the pair briefly above the 0.7440 line before closing at 0.7430.

Looking up, 0.7440 was a stubborn peak at the beginning of the year and now provides immediate resistance. It’s followed by 0.7523 which was a swing high in November 2009.

Above, 0.7634 was a peak in October and is the highest level in two years. Beyond, 0.7760 and 0.7920 are distant lines that were last seen in 2008.

Looking down, 0.74 temporarily capped the pair in the past week and also July – it’s now an immediate support line. 0.7350 that capped the pair at the end of July and the beginning of August, is now a minor line after being shattered in the past week.

0.7260 provided support at the beginning of September and is already a more significant line of support. 0.7210 is another support line from September.

Below, 0.71 worked in both directions in August. It’s followed by the round number of 0.70, that had a role many times in the past.

I turn from neutral to bearish on the kiwi.

Fundamentals in New Zealand weren’t too good in the past week. Without extreme greenback weakness, the kiwi cannot continue running.

Sunday, September 19, 2010

NZD/USD Weekly Technical Forecast (Sep 20-24 2010)


GDP leads the pack of economic indicators that will move the kiwi in the upcoming week. Here’s an outlook for the events in New Zealand and an updated technical analysis for NZD/USD.

NZD/USD daily chart with support and resistance lines on it. Click to enlarge:

NZD USD Forecast September 20-24

The RBNZ decided to leave the interest rate unchanged at 3%. While this was expected, the gloomy statement was a burden on the kiwi. We’ll now get an overall picture of the economy:

  1. Visitor Arrivals: Monday, 22:45. The economy of New Zealand is dependent on tourism, making this indicator important. Last month saw a rise of 1.4%, double the previous month. This time, the number will probably fall.

  2. Credit Card Spending: Tuesday, 3:00. This indicator complement the retail sales figure, as a significant portion of consumption is done via credit cards. Strong rises were seen in recent months – 3.4%, 4.5% and 2.7%. A rise is expected this time as well, but it will probably be more modest.

  3. Current Account: Tuesday, 22:45. This quarterly figure is of high importance, despite being published rather late and after the related trade balance number has already been released. Q1 was a big surprise – a small surplus was reported on top of expectations for a deficit in the current account. Q2 will probably see a surplus as well.

  4. GDP: Wednesday, 22:45. New Zealand enjoys economic growth for a full year. The growth rate in Q4 of 2009 and in Q1 of 2010 exceeded expectations, 0.9% and 0.6% respectively. As the unemployment rate jumped, and retail sales slumped, the growth rate will probably be weaker this time, at 0.5%.


NZD/USD Technical Analysis

The kiwi began the week higher – it traded between 0.7290 to 0.7350 (appeared last week as well). An attempt to break higher bounced just under 0.74 and the pair fell down to support at 0.72. Another recovery sent the pair to close at 0.7246.

The past week’s low of .7210 now provides minor support for NZD/USD. The next support line is very close – 0.7160 capped the pair in June and provided support recently.

Lower, 0.71 worked as a stepping stone in the recent ascent and is a minor support line. Below, the round number of 0.70 is already a strong line. It’s followed by 0.69, which capped the pair when it was trading lower, during the turmoil in May.

Looking up, 0.7290 is the immediate line of resistance, followed by 0.7350, which is now a strong resistance line.

Above, the next line of resistance is very close – 0.74 – it capped the pair just this week, and also in July. This double top is key resistance. Above, 0.7440 which held the pair for a few consecutive days at the beginning of the year, is the next line of resistance.

I remain bearish on NZD/USD.

With the pause in rate hikes, and the expected weaker GDP, the kiwi is likely to under-perform.

Sunday, September 5, 2010

NZD/USD Weekly Technical Forecast (Sep 6-10 2010)

The kiwi expects a rather lightweight week in terms of economic indicators, so the technicals will play a bigger role. Here’s an outlook for the events in New Zealand, and an updated technical analysis for NZD/USD.

NZD/USD daily graph with support and resistance lines on it. Click to enlarge:

nzd usd kiwi forecast

The managed to break higher after frustrating. Will this trend continue?

  1. Manufacturing Sales: Published on Tuesday at 22:45 GMT. While being a rather late figure, the quarterly frequency makes this number important. New Zealand is expected to enjoy a third straight quarter of growth in the volume of sales at manufacturers gates, after 0.7% and 0.9% rises beforehand.

  2. Overseas Trade Index: Published on Thursday at 22:45 GMT. This indicator has proven very relevant for New Zealand. It measures the change in purchase power. The past two quarters were positive, with rises of 5.7% and 5.9%. Another quarter of growth is predicted now, but it will probably be more modest – 2.3%.


NZD/USD Technical Analysis

The kiwi had a bad start with a drop under 0.70. It bottomed out at 0.6947 before recovering. After a struggle with the 0.7160 line (mentioned in last week’s outlook), Friday’s move sent it temporarily above 0.72, reaching 0.7218 before closing just under 0.72.

NZD/USD is now in a narrow range between 0.7160, which was a stubborn peak in June and also in the past week, to 0.72, which also worked as support.

Below, 0.70 is a critical round number that is closely eyed by traders. Lower, 0.69 is the next line of support. It previously worked as a line of resistance in May, after the pair fell down sharply.

Below, 0.68, that was a swing low in mid-July and also held NZD/USD in February is the next support line. Lower, 0.6685 worked as support back in September and was a pivotal line in July. The final line for now is the year-to-date low of 0.6560.

Looking up, 0.7325 capped the pair during August and serves as the next resistance line if 0.72 is cleared. This is followed by  the 0.7440 region, which capped the pair when it traded higher.

Higher, 0.7523 was a swing high back in November 2009, and serves as a minor line of resistance. Even higher, the 0.7634 peak reached almost a year ago, is the final frontier for now.

I am neutral on NZD/USD this week.

Without really important data, the kiwi is likely to swing with the mood in the global markets. The earthquake that hit the country’s southern island isn’t expected to cause an earthquake in currencies.

NZD/USD Weekly Technical Forecast (Sep 6-10 2010)

The kiwi expects a rather lightweight week in terms of economic indicators, so the technicals will play a bigger role. Here’s an outlook for the events in New Zealand, and an updated technical analysis for NZD/USD.

NZD/USD daily graph with support and resistance lines on it. Click to enlarge:

nzd usd kiwi forecast

The managed to break higher after frustrating. Will this trend continue?

  1. Manufacturing Sales: Published on Tuesday at 22:45 GMT. While being a rather late figure, the quarterly frequency makes this number important. New Zealand is expected to enjoy a third straight quarter of growth in the volume of sales at manufacturers gates, after 0.7% and 0.9% rises beforehand.

  2. Overseas Trade Index: Published on Thursday at 22:45 GMT. This indicator has proven very relevant for New Zealand. It measures the change in purchase power. The past two quarters were positive, with rises of 5.7% and 5.9%. Another quarter of growth is predicted now, but it will probably be more modest – 2.3%.


NZD/USD Technical Analysis

The kiwi had a bad start with a drop under 0.70. It bottomed out at 0.6947 before recovering. After a struggle with the 0.7160 line (mentioned in last week’s outlook), Friday’s move sent it temporarily above 0.72, reaching 0.7218 before closing just under 0.72.

NZD/USD is now in a narrow range between 0.7160, which was a stubborn peak in June and also in the past week, to 0.72, which also worked as support.

Below, 0.70 is a critical round number that is closely eyed by traders. Lower, 0.69 is the next line of support. It previously worked as a line of resistance in May, after the pair fell down sharply.

Below, 0.68, that was a swing low in mid-July and also held NZD/USD in February is the next support line. Lower, 0.6685 worked as support back in September and was a pivotal line in July. The final line for now is the year-to-date low of 0.6560.

Looking up, 0.7325 capped the pair during August and serves as the next resistance line if 0.72 is cleared. This is followed by  the 0.7440 region, which capped the pair when it traded higher.

Higher, 0.7523 was a swing high back in November 2009, and serves as a minor line of resistance. Even higher, the 0.7634 peak reached almost a year ago, is the final frontier for now.

I am neutral on NZD/USD this week.

Without really important data, the kiwi is likely to swing with the mood in the global markets. The earthquake that hit the country’s southern island isn’t expected to cause an earthquake in currencies.

Sunday, August 29, 2010

NZD/USD Weekly Technical Forecast (Aug 30-Sep 03)


4 events await kiwi traders in the upcoming week, with the business confidence being the highlight. Here’s an outlook for the events in New Zealand and an updated technical analysis for NZD/USD.

NZD/USD daily chart with support and resistance lines marked. Click to enlarge:

nzd usd forecast

The kiwi saw tensed range trading in the past week and didn’t make dramatic moves. This week should provide more action, after the summer vacation is over. Let’s start:

  1. Trade Balance: Published on Sunday at 22:45 GMT. New Zealand enjoyed many months of surplus in its trade balance. But after it squeezed sharply to 276 million last month, it’s now expected to turn negative – a deficit of 37 is expected in the month of July.

  2. NBNZ Business Confidence: Published on Monday at 3:00 GMT. This wide survey of 1500 businesses has shown a significant decline last month, dropping from 40.2 to 27.9 points and weakening the kiwi. Another small drop is expected now.

  3. Building Consents: Published on Monday at 22:45 GMT. This figure, known elsewhere as building approvals, recovered last month with a 3.5% rise after a 9.6% fall in the previous month. While this indicator is quite volatile, it’s still important for the New Zealand dollar. A drop is likely this time.

  4. ANZ Commodity Prices: Published on Wednesday at 3:00 GMT. Month over month commodity prices have dropped in the past two months. New Zealand’s economy suffers from lower commodity prices, as it’s a big exporter of commodities. A small rise is expected this time.


NZD/USD Technical Analysis

During most of the week, NZD/USD traded between 0.70 and 0.71. A dip under 0.70 was short-lived, and a rise on Friday lost air towards the 0.7160 resistance line (mentioned in last week’s outlook). The kiwi finally closed at 0.7106.

The pair continues to range between 0.70, the round number that is a strong line of support, and 0.7160 which was a stubborn peak in June.

Looking down, 0.69 is the next line of support. It previously worked as a line of resistance in May, after the pair fell down sharply.

Below, 0.68, that was a swing low in mid-July and also held NZD/USD in February is the next support line. Lower, 0.6685 worked as support back in September and was a pivotal line in July. The final line for now is the year-to-date low of 0.6560.

Above 0.7160, the next resistance line is 0.72 that worked as support quite recently. Higher, 0.7325 that was an area of struggle and also a peak in May is the next line of resistance, followed by the 0.7440 region, which capped the pair when it traded higher.

I remain bearish on NZD/USD.

As the chances of double-dip recession in the US seem strong, risk aversive trading hurts the kiwi. As the last big release from New Zealand was the very disappointing rise in unemployment, the pair isn’t well positioned to weather the storm.

Saturday, August 7, 2010

NZD/USD Weekly Technical Forecast (Aug 9-13 2010)


Retail sales and other figures will shape the direction of the kiwi in the upcoming week. Here’s an outlook for the events that will move the New Zealand dollar, and an updated technical analysis for NZD/USD.

NZD/USD chart with support and resistance lines marked. Click to enlarge:

nzd usd forecast

The kiwi was hurt by the disappointing employment figures, that showed a worrying leap of the unemployment rate to 6.8%. This erased some of the kiwi’s gains. Will we see positive numbers this time? Let’s start:

  1. Business NZ Manufacturing Index: Published on Wednesday at 22:30 GMT. This survey of manufacturers is very similar to purchasing managers’ indices in other countries. Since last September, this figure was positive – above 50 points. From 56.2 points last month, the index is expected to edge up to new highs.

  2. FPI: Published on Wednesday at 22:45 GMT. New Zealand is a huge exported of food, making it dependent on prices. The Food Price Index rose by 1.3% last month, after two months of drops. It’s expected to continue rising now.

  3. Retail Sales: Published on Thursday at 22:45 GMT. This important consumer figure always shakes the kiwi. Retail sales rose by 0.4% and are expected to rise by the same scale now. Core retail sales caused worries last month when the drop by 0.2%, and are now expected to rise by 0.6% each.


NZD/USD Technical Analysis

The kiwi managed to rise above 0.7325 which it flirted with in the previous week but struggled to hold on to it. Employment data in New Zealand sent it down in the middle of the week, before American employment data on Friday helped it close at 0.7330, just above this resistance line.

Note that some lines were modified since last week’s outlook. If 0.7325 holds this time, the road is open towards the next line of resistance – 0.7440 – the stubborn top at the beginning of the week.

Higher, November’s peak of 0.7523 provides the next resistance line, and it’s followed by 0.7634, a peak in October.

The next line of resistance comes from the era before the global crisis – July 2008. 0.7760 was a resistance line back then, and was a support line beforehand.

Looking down below 0.7325, the round number of 0.72 provides strong support for the kiwi. The next support line is quite close – 0.7160 which capped the pair in June.

The next round number of 0.70 serves as further support. It’s followed by 0.6910 which capped the pair at the beginning of the year.

I turn neutral on NZD/USD.

The employment figures were very disappointing and will probably cause pauses in raising the rates. On the other hand, US weakness can support the kiwi.

Sunday, August 1, 2010

NZD/USD Weekly Technical Forecast ( Aug 2-6 2010)


Employment figures dominate the upcoming week’s kiwi trading. Here’s an outlook for the events in New Zealand and an updated technical analysis for NZD/USD.

NZD/USD daily chart with support and resistance lines on it. Click to enlarge:

nzd usd forecast

The kiwi reached new highs in the past week, on top of the expected rate hike, but it didn’t hold on to these gains. It now depends on the employment figures, which will have a long-term effect on the pair. Let’s start:

  1. ANZ Commodity Prices: Published on Monday at 3:00 GMT. This time, the release of commodity prices is released just before the similar Australian release, making it more significant. Last month saw the first drop in prices in 16 months, and this hurt the kiwi. But after a drop of 1.2% last month, prices are expected to rise this time.

  2. Labor Cost Index: Published on Monday at 22:45 GMT. This major quarterly index is an interesting combination of inflation and employment, being a great warm up for the employment figures. After two consecutive quarters of rises in a scale of 0.3% – the cost of labor will probably rise by 0.4% this time.

  3. Employment data: Published on Wednesday at 22:45 GMT. Employment figures always shake the markets. In New Zealand, the effect is more significant, as these figures are published only once per quarter. The last release was superb – unemployment change jumped by 1%, and the unemployment rate made a steep drop from 7.1% to 6%, boosting both the kiwi and the Aussie. But this quarter won’t be that good – employment is expected to rise by only 0.5% and the unemployment rate is predicted to rise from 6% to 6.2% – still OK.


NZD/USD Technical Analysis

The kiwi rose gradually and then made a sharp move above the 0.7325 resistance line. This was short lived – after peaking just under 0.74, NZD/USD dropped back down and found support at 0.72, before closing at 07250.

Most of the lines haven’t changed since last week’s outlook. NZD/USD is bound once again between 0.72, a round number that worked in both directions and 0.7325 which capped the pair in May.

Above, 0.7440 was a stubborn peak at the beginning of the year, and also the place where the pair fell from in October 2009. Higher, 0.7523 was a peak in November and now works as resistance. This is followed by 0.7634, the highest level since the outbreak of the financial crisis.

Below, 0.72, the next line of support is very close, at 0.7160 – which worked as resistance in June. The round number of 0.70 provides the next support line.

Lower, 0.6910 capped the pair in May and now works as a line of resistance. It’s followed by 0.68. There are many lines below, with the most notable one being 0.6560, the 2010 low.

I remain bullish on NZD/USD.

With a higher interest rate, and with an expected rise in employment, the kiwi has more room to rise.