
Monday, August 9, 2010
EUR/USD Daily Technical Forecast (Aug-10-2010)
The EURUSD failed to continue its bullish scenario yesterday after unable to re-test 1.3340 resistance level, bottomed at 1.3215 and keep moving lower around 1.3190 at the time I wrote this comment. The bias is bearish in nearest term testing 1.3105 area but note that we are still in bullish phase. Immediate resistance at 1.3250. Another move above that area could trigger further upside pressure testing 1.3340. We are entering the tricky phase here as we have conflicting bias between short term (bearish) and medium term (bullish). Fundamental focus will be on the FOMC statement.


GBP/USD Daily Technical Forecast (Aug-10-2010)
The GBPUSD had a bearish momentum yesterday after unable to move consistently above 1.5966, bottomed at 1.5892 and keep moving lower around 1.5820 at the time I wrote this comment. The bias is bearish in nearest term especially if price able to move consistently below 1.5815 area targeting 1.5735. We are entering the tricky phase here as we have conflicting bias between short term (bearish) and medium term (bullish). Fundamental focus will be on FOMC statement.

USD/JPY Daily Techncail Forecast (Aug-10-2010)
The USDJPY attempted to push higher yesterday, but as you can see on my h4 chart below the minor trendline resistance did a good job so far. The bias remains neutral and we may have another upside pressure re-testing the minor trendline resistance but overall the major scenario remains bearish. Consistent move above the minor trendline resistance and 85.96 area could trigger further upside correction testing 86.50 - 87.00 area. On the downside, 85.32 and 84.82 remains the nearest bearish target before testing 83.35 region.

Saturday, August 7, 2010
EUR/USD weekly Technical Forecast (Aug 9-13 2010)
After riding the Non-Farm Payrolls, a busy week expects Euro traders, with the best kept for last – GDP figures on Friday. Here’s an outlook for the European events, and an updated technical analysis for EUR/USD.
EUR/USD chart with support and resistance lines marked. Click to enlarge:

The Euro enjoyed the reports that the US central bank will take new steps to boost the economy, by printing dollars. Now, the focus returns to the European core figures. Let’s start:
EUR/USD Technical Analysis
At the beginning of the week, EUR/USD made an initial breakout above 1.3114. It then traded between this line, that turned into a strong support line, to the next barrier, 1.3267. On Friday, it leaned on the channel support line, which stood on 1.3160 at that time, before jumping higher. From the peak of 1.3333 it managed to settle at 1.3280, a weekly gain of 220 pips – a sixth consecutive week of gains.
Some lines were added on last week’s outlook. The pair currently ranges between 1.3267, the line it broke on the Non-Farm Payrolls, and 1.3435, the next barrier, which was a strong support line in February.
Higher, 1.3545 serves as the next line of resistance after providing support for the pair in March. 1.37 is the next line of resistance, working as in April, and it’s followed by 1.3850 which is a strong and clear line of both support and resistance.
Looking down, 1.3114 which was the place where the pair collapsed from in May, is now a strong support line. Also in the past week, it turned from a clear resistance line to a clear line of support.
Lower, 1.3028 had a minor role in the recent Euro rally. It’s followed by 1.2880, which was a support line in 2009 and then by 1.2722 which held the pair temporarily in July. There are many lines below, but they’re too far now.
It’s also important to notice the steep uptrend channel, also marked on the graph. EUR/USD is currently in the middle of this uptrend channel, far enough from falling.
I remain Bullish on EUR/USD.
US weakness, as seen in the Non-Farm Payrolls, continues to fuel EUR/USD. It might get a fresh boost from the new dollar printing schemes by the Federal Reserve, but could suffer a disappointment from the European GDP, as expectations are high.
EUR/USD chart with support and resistance lines marked. Click to enlarge:

The Euro enjoyed the reports that the US central bank will take new steps to boost the economy, by printing dollars. Now, the focus returns to the European core figures. Let’s start:
- Sentix Investor Confidence: Published on Monday at 8:30 GMT. This official European survey of 2,800 analysts and investors has significantly improved in recent months, but the output was still negative – minus 1.3 last month, meaning that the overall mood is still pessimistic. A rise to 2.4 points, a positive number will boost the Euro.
- German Final CPI: Published on Tuesday at 6:00 GMT. After a few volatile months, Germany’s consumer prices stabilized at small changes. The initial figure of a small 0.2% rise will probably be confirmed now.
- French Industrial Production: Published on Tuesday at 6:45 GMT. Europe’s second largest economy rebounded nicely last month, with a 1.7% growth rate. This time, a drop will probably be seen.
- ECB Monthly Bulletin: Published on Thursday at 8:00 GMT. Following the rate decision with its optimistic sentiment, we’ll get to see what the data was based on. This release shows what data the members of the ECB saw when making their decision. This could boost the Euro.
- Industrial Production: Published on Thursday at 9:00 GMT. This publication for the whole continent comes after Germany and France already released their own numbers. Nevertheless, the overall picture is very important. After a surprising 1% rise last month, a rise in a scale of 0.7% will probably be seen now.
- German Prelim GDP: Published on Friday at 6:00 GMT. Germany has been the locomotive of the whole Euro zone, showing impressive industrial output and dropping unemployment. So, the positive growth rate of 0.2% seen in Q1 will probably be followed with a strong 1.3% in Q2, and might be even stronger, boosting the Euro.
- French Prelim Non-Farm Payrolls: Published on Friday at 6:45 GMT. This quarterly release showed a small growth in French employment – 0.2% in Q1. Q2’s figure will probably be similar – 0.3%.
- French GDP: Published on Friday at 6:45 GMT. Published 45 minutes after the German figure, this number can stabilize the Euro before the release of the figure for the whole continent. The weak growth rate of 0.1% in Q1 is likely to be followed by a slightly stronger growth rate – 0.4%, or an unchanged figure. Contraction will hurt the Euro.
- Flash GDP: Published on Friday at 9:00 GMT. There’s a big difference between the different members of the Euro-zone. While Germany, France and Holland march forward, Italy, Spain, Portugal and Greece suffer. After three quarters of growth, there’s a big danger of seeing new contraction – a double dip recession. But, expectations are very high – a growth rate of 0.7%. This figure will rock the Euro and other currencies as well.
EUR/USD Technical Analysis
At the beginning of the week, EUR/USD made an initial breakout above 1.3114. It then traded between this line, that turned into a strong support line, to the next barrier, 1.3267. On Friday, it leaned on the channel support line, which stood on 1.3160 at that time, before jumping higher. From the peak of 1.3333 it managed to settle at 1.3280, a weekly gain of 220 pips – a sixth consecutive week of gains.
Some lines were added on last week’s outlook. The pair currently ranges between 1.3267, the line it broke on the Non-Farm Payrolls, and 1.3435, the next barrier, which was a strong support line in February.
Higher, 1.3545 serves as the next line of resistance after providing support for the pair in March. 1.37 is the next line of resistance, working as in April, and it’s followed by 1.3850 which is a strong and clear line of both support and resistance.
Looking down, 1.3114 which was the place where the pair collapsed from in May, is now a strong support line. Also in the past week, it turned from a clear resistance line to a clear line of support.
Lower, 1.3028 had a minor role in the recent Euro rally. It’s followed by 1.2880, which was a support line in 2009 and then by 1.2722 which held the pair temporarily in July. There are many lines below, but they’re too far now.
It’s also important to notice the steep uptrend channel, also marked on the graph. EUR/USD is currently in the middle of this uptrend channel, far enough from falling.
I remain Bullish on EUR/USD.
US weakness, as seen in the Non-Farm Payrolls, continues to fuel EUR/USD. It might get a fresh boost from the new dollar printing schemes by the Federal Reserve, but could suffer a disappointment from the European GDP, as expectations are high.
GBP/USD Weekly Technical Forecast (Aug 9-13 2010)
Employment data and King’s report about inflation are the limelight of this week’s events. Here’s an outlook for the events that will rock the Pound, and an updated technical analysis for GBP/USD.
GBP/USD chart with support and resistance lines marked. Click to enlarge:
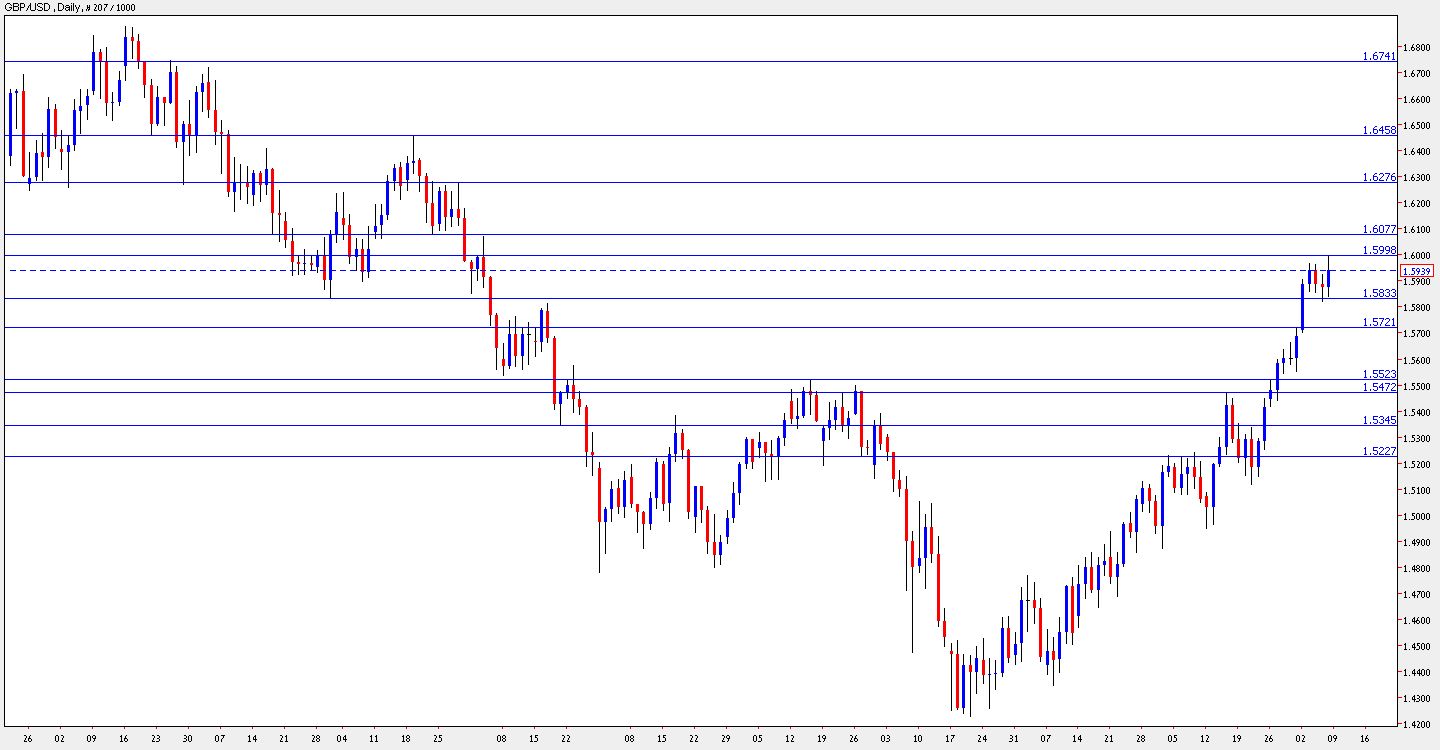
The British Pound made another nice week of rises. Will this continue? It seems that more serious moves about the interest rate are necessary. We could get them this week. Let’s start:
- BRC Retail Sales Monitor: Published on Monday at 23:00 GMT (midnight UK). This unofficial retail sales release shows that consumers bought more in the past two months. While this figure is not as wide as the official number, it has a strong impact. A rise in a smaller scale is expected now.
- RICS House Price Balance: Published on Monday at 23:00 GMT. The Royal Institution of Chartered Surveyors has shown that the real estate market is cooling again, with less regions reporting an increase in prices. From a peak of 35%, the figure dropped to 9% and will probably drop once again to 5%.
- Trade Balance: Published on Tuesday at 8:30 GMT. Britain’s deficit rose to 8.1 billion last month, the highest level in 17 months, hurting the Pound, as it happened also beforehand. This deficit will probably squeeze now to around 7.7 billion.
- CB Leading Index: Published on Tuesday at 9:00 GMT. The growth rate in this composite index dropped from over 1% to 0.3% last month, the lowest in a year. This time, the composite index built of 7 indicators will probably rise by more than 0.5%.
- Nationwide Consumer Confidence: Published on Tuesday at 23:00 GMT – delayed from last week. This survey of 1000 consumers is “over the hill”, dropping from 81 to 63 points. Another drop is expected now to 60 points. Note that in this case, the delay weakens the impact.
- Employment data: Published on Wednesday at 8:30 GMT. Britain enjoyed a significant drop in the number of people claiming unemployment benefits in the past few months, exceeding expectations (Claimant Count Change). The drop of almost 21K last month will probably be followed by another drop of 17.9K this time, in the month of July. The unemployment rate for June will probably remain unchanged at 7.8% in June. Another drop will boost the Pound. This figure is accompanied by the Average Earnings Index, which will probably rise in a rate lower than last month’s 2.7% rise.
- BOE Inflation Report: Published on Wednesday at 9:30 GMT. While cable traders still analyze the employment data, Mervyn King, head of the BoE, will present the inflation report in a press conference. It will be very interesting to see how King relates to the rising inflation, after finally acknowledging its risks. Will we see hints of an upcoming rate?
GBP/USD Technical Analysis
The Pound began the week with a struggle around the minor resistance line of 1.5720. As it made an upwards breakout, it cleared 1.5833 quite easily. Then, 1.5833 turned into a support line, as the pair traded between 1.5833 and 1.60 (a new line that didn’t appear on last week’s outlook.), before closing at 1.5939.
The round number of 1.60 is the immediate level of resistance. It’s followed by 1.6080 which was a support line in January and now works as resistance. Higher, 1.6270 last worked as a resistance line in January and beforehand as a support line.
The peak at 1.6450 works as the next minor line of resistance, and it’s followed by 1.6720, which capped the pair several times at the end of 2009.
Looking down, 1.5833 turns into a strong support line. It’s followed by the minor line of 1.5720 which was a support line in 2009 and then by 1.5520, which capped the pair in April and worked as support in February.
Below, 1.5470 is very close, holding the pair a few weeks ago. 1.5350 was a recent resistance line, and now serves as a line of support. It’s followed by 1.5230 which was a stubborn line at the beginning of July.
I remain bullish on GBP/USD.
Fresh employment data and Mervyn King’s talk about inflation can provide the pair with new strength to rise, after clearing the strong barriers.
AUD/USD Weekly Technical Forecast (Aug 9-13 2010)
The release of employment data is the main event for the rising Aussie. Here’s an outlook for the Australian events, and an updated technical analysis for AUD/USD.
AUD/USD chart with support and resistance lines marked. Click to enlarge:

Glenn Stevens left the interest rate unchanged at 4.50%, exactly as expected. The Aussie enjoyed other figures and US weakness to rise. Will this continue? It now depends on jobs. Let’s start:
- ANZ Job Advertisements: Published on Monday at 1:30 GMT. Delayed from last week. This unofficial employment gauge serves as warm up for the official job figures due 9 days later. The amount of jobs advertised in the media made a nice rise of 2.7%, going hand in hand with the improvement seen in the official figures. Another rise is expected this time.
- Home Loans: Published on Monday at 1:30 GMT. After a few months of drops in loans – the outcome of the rate hikes, Australians took more mortgages last month. After rising by 1.9% last months, loans are expected to drop by 2.1% this time. Note that the ANZ job advertisements slightly overshadows this release.
- NAB Business Confidence: Published on Tuesday at 1:30 GMT. National Bank Australia surveys 350 businesses for this important gauge. After peaking at 19 points, this indicator dropped gradually to 4 points last month, still positive – meaning economic improvement. It’s expected to rise now.
- Westpac Consumer Sentiment: Published on Wednesday at 00:30 GMT. This bank surveys consumers – 1200 of them. After three months of drops, consumers’ mood became optimistic once again, with confidence leaping by 11.1% last month. A much smaller rise will probably be seen now.
- MI Inflation Expectations: Published on Thursday at 1:00 GMT. Melbourne Institute fills in for the government, that published inflation data only once a quarter. Inflation expectations dropped to 3.3% last month – a drop that goes hand in hand with the low CPI. This time, inflation isn’t expected to continue dropping. A rise above 4% will boost the Aussie.
- Employment data: Published on Thursday at 1:30 GMT. Australia enjoyed 4 excellent months of growth in jobs (employment change), exceeding expectations each time. This was accompanied by a drop in the unemployment rate, to 5.1%. This has been one of the main drivers of the currency. Good figures are expected again – another gain of 20,100 jobs and an unchanged unemployment rate, remaining low. These should boost the Aussie.
AUD/USD Technical Analysis
The Aussie began the week with a storm, jumping above the 0.9070 it struggled with in the previous week. It then traded in a tight range between 0.9070 to 0.9135, and it eventually broke this strong barrier as well. After touching the next resistance line of 0.9220 it closed lower, at 0.9177.
Some lines were modified since last week’s outlook. The Aussie is range bound between 0.9220, which was a support line in April, and 0.9135 which was a support line in May.
Looking down, 0.9070 now turns into a support line, after capping the pair recently. Below, the round number of 0.90 is the next support line – it was also a swing low in March.
Lower, 0.8870 was a stubborn resistance line in June and in July and now works as strong support. There are many more lines below, but they’re too far at the moment.
Above 0.9220, the next line one of the most persistent lines – 0.9327, which first capped the pair in October 2009, and continued being tested many times afterwards.
Higher, 0.9360 was a peak in April and works as a minor resistance line. The 2009 high of 0.94 is the next line of resistance, and it’s followed by 0.95 which was an important line in 2008.
I remain bullish on the Aussie.
Australia continues to enjoy a surplus in its trade balance, a high interest rate, and it should receive a boost from job data, which tends to exceed expectations.
NZD/USD Weekly Technical Forecast (Aug 9-13 2010)
Retail sales and other figures will shape the direction of the kiwi in the upcoming week. Here’s an outlook for the events that will move the New Zealand dollar, and an updated technical analysis for NZD/USD.
NZD/USD chart with support and resistance lines marked. Click to enlarge:

The kiwi was hurt by the disappointing employment figures, that showed a worrying leap of the unemployment rate to 6.8%. This erased some of the kiwi’s gains. Will we see positive numbers this time? Let’s start:
- Business NZ Manufacturing Index: Published on Wednesday at 22:30 GMT. This survey of manufacturers is very similar to purchasing managers’ indices in other countries. Since last September, this figure was positive – above 50 points. From 56.2 points last month, the index is expected to edge up to new highs.
- FPI: Published on Wednesday at 22:45 GMT. New Zealand is a huge exported of food, making it dependent on prices. The Food Price Index rose by 1.3% last month, after two months of drops. It’s expected to continue rising now.
- Retail Sales: Published on Thursday at 22:45 GMT. This important consumer figure always shakes the kiwi. Retail sales rose by 0.4% and are expected to rise by the same scale now. Core retail sales caused worries last month when the drop by 0.2%, and are now expected to rise by 0.6% each.
NZD/USD Technical Analysis
The kiwi managed to rise above 0.7325 which it flirted with in the previous week but struggled to hold on to it. Employment data in New Zealand sent it down in the middle of the week, before American employment data on Friday helped it close at 0.7330, just above this resistance line.
Note that some lines were modified since last week’s outlook. If 0.7325 holds this time, the road is open towards the next line of resistance – 0.7440 – the stubborn top at the beginning of the week.
Higher, November’s peak of 0.7523 provides the next resistance line, and it’s followed by 0.7634, a peak in October.
The next line of resistance comes from the era before the global crisis – July 2008. 0.7760 was a resistance line back then, and was a support line beforehand.
Looking down below 0.7325, the round number of 0.72 provides strong support for the kiwi. The next support line is quite close – 0.7160 which capped the pair in June.
The next round number of 0.70 serves as further support. It’s followed by 0.6910 which capped the pair at the beginning of the year.
I turn neutral on NZD/USD.
The employment figures were very disappointing and will probably cause pauses in raising the rates. On the other hand, US weakness can support the kiwi.
Demo Trading Will Make You Successful?… Guess Again
Guest post from visionsofaffluence.com
Demo trading. We are all familiar with it. We have all heard the advice of the experts that tell you that you should demo trade first in order to learn how to trade. Indeed demo trading is thought by many to be the path to trading success because by allowing people to trade without risking any money gives them the chance to learn how to trade without the fear of losing money. This lack of risk however is what makes demo trading ineffective at creating successful traders, because without the risk of losing money you will never be able to deal with the emotions that cripple so many traders.
Now I’m not saying that you shouldn’t demo trade at all, but if you think that you are going to spend some time demo trading and then be able to go live and start making profits then you have another thing coming. You see trading in a simulated environment without any risk of loss will not help your trading. In order to become a successful trader you are going to have to master you emotions and get over the psychological handicaps that plague most new traders. There is no way you can do this trading a demo account because you won’t have any real money at risk and therefore you won’t be able to deal with the psychological aspect of trading.
In order to become a successful trader you are going to have to learn how you deal with risk when there is real money on the line. In a demo account you aren’t risking anything so that trading amounts to little more than a videogame. It’s a simulation that will teach you the mechanics of trading but it will not prepare you for the many psychological pitfalls that will await you once you go live. I have seen many traders make a killing in a demo account but once it comes to real money they fall apart. So if your trading a demo account and think that you are going to go live and be a trading superstar then you are in for a rude awakening. Once again I’m not saying that you shouldn’t demo trade at all just that you should think of it as orientation and that class doesn’t begin until you open your first trade with real money on the line.
Demo trading. We are all familiar with it. We have all heard the advice of the experts that tell you that you should demo trade first in order to learn how to trade. Indeed demo trading is thought by many to be the path to trading success because by allowing people to trade without risking any money gives them the chance to learn how to trade without the fear of losing money. This lack of risk however is what makes demo trading ineffective at creating successful traders, because without the risk of losing money you will never be able to deal with the emotions that cripple so many traders.
Now I’m not saying that you shouldn’t demo trade at all, but if you think that you are going to spend some time demo trading and then be able to go live and start making profits then you have another thing coming. You see trading in a simulated environment without any risk of loss will not help your trading. In order to become a successful trader you are going to have to master you emotions and get over the psychological handicaps that plague most new traders. There is no way you can do this trading a demo account because you won’t have any real money at risk and therefore you won’t be able to deal with the psychological aspect of trading.
In order to become a successful trader you are going to have to learn how you deal with risk when there is real money on the line. In a demo account you aren’t risking anything so that trading amounts to little more than a videogame. It’s a simulation that will teach you the mechanics of trading but it will not prepare you for the many psychological pitfalls that will await you once you go live. I have seen many traders make a killing in a demo account but once it comes to real money they fall apart. So if your trading a demo account and think that you are going to go live and be a trading superstar then you are in for a rude awakening. Once again I’m not saying that you shouldn’t demo trade at all just that you should think of it as orientation and that class doesn’t begin until you open your first trade with real money on the line.
EUR/USD Rises on NFP, But Gains Could Be Capped
US Non-Farm Payrolls dropped by 131K, double the median expectations. This result is very disappointing. EUR/USD leaped from 1.3170 before the release to 1.3220 immediately afterwards. Note that the private sector, which is in the limelight added 71,000 jobs, so the Euro might not have the strength needed to break higher.
The unemployment rate remained unchanged at 9.5%, slightly better than a rise to 9.6% that was expected. But this isn’t important:
What is important is that the private sector gained jobs – 71,000. This is a better report than the ADP number (48K), although slightly worse than expected (90K) and it could ease the fall of the dollar, despite the terrible headline figure. So, 1.3267 – the peak at the beginning of the week which is also an important resistance line, could hold.
Update: EUR/USD made the break higher but stayed close to the resistance line – 1.3267.
Earlier this week, the ADP Non-Farm Payrolls report was slightly better than expected. It showed a gain of 48,000 jobs in the private sector. This created hope for a better result in the official Non-Farm Payrolls, especially as the government’s census in May still has an impact on the headline number. As written in the NFP preview, the private sector part of the NFP was in the limelight, making also the ADP report more important.
The US dollar lost ground up to Wednesday’s ADP report, the dollar lost ground, and then it stabilized. On the other hand, Thursday’s weekly jobless claims report was disappointing – it rose to 479K, just below the top border of a range that characterizes this figure in recent months. But this didn’t have too much impact on the greenback – tension remained high and trading became quite tight before the release.
EUR/USD got close to the bottom border of the uptrend channel, but managed to stay away before the release, and even escape it as the New York session opened at 12:00 GMT. As aforementioned, it later jumped.
EUR/USD Technicals
A break above 1.3267 will open the road to 1.3392, the uptrend resistance (currently at this zone), and then to the important 1.3435 line, which was a support line in the past.
A drop will send the pair to support around 1.3160, which is the uptrend support line at the moment and further below to 1.3114 – which turned from a strong line of resistance to a strong line of support this week.
Other Currencies
The Canadian dollar suffered from losses against the greenback, due to its own employment data. Canada lost jobs in July – this disappointing outcome sent USD/CAD above 1.02.
Other currencies remained around earlier levels before the release, and reacted in a similar way to the Euro afterwards.
The unemployment rate remained unchanged at 9.5%, slightly better than a rise to 9.6% that was expected. But this isn’t important:
What is important is that the private sector gained jobs – 71,000. This is a better report than the ADP number (48K), although slightly worse than expected (90K) and it could ease the fall of the dollar, despite the terrible headline figure. So, 1.3267 – the peak at the beginning of the week which is also an important resistance line, could hold.
Update: EUR/USD made the break higher but stayed close to the resistance line – 1.3267.
Earlier this week, the ADP Non-Farm Payrolls report was slightly better than expected. It showed a gain of 48,000 jobs in the private sector. This created hope for a better result in the official Non-Farm Payrolls, especially as the government’s census in May still has an impact on the headline number. As written in the NFP preview, the private sector part of the NFP was in the limelight, making also the ADP report more important.
The US dollar lost ground up to Wednesday’s ADP report, the dollar lost ground, and then it stabilized. On the other hand, Thursday’s weekly jobless claims report was disappointing – it rose to 479K, just below the top border of a range that characterizes this figure in recent months. But this didn’t have too much impact on the greenback – tension remained high and trading became quite tight before the release.
EUR/USD got close to the bottom border of the uptrend channel, but managed to stay away before the release, and even escape it as the New York session opened at 12:00 GMT. As aforementioned, it later jumped.
EUR/USD Technicals
A break above 1.3267 will open the road to 1.3392, the uptrend resistance (currently at this zone), and then to the important 1.3435 line, which was a support line in the past.
A drop will send the pair to support around 1.3160, which is the uptrend support line at the moment and further below to 1.3114 – which turned from a strong line of resistance to a strong line of support this week.
Other Currencies
The Canadian dollar suffered from losses against the greenback, due to its own employment data. Canada lost jobs in July – this disappointing outcome sent USD/CAD above 1.02.
Other currencies remained around earlier levels before the release, and reacted in a similar way to the Euro afterwards.
Sunday, August 1, 2010
Time to Buy Dollars as Euro Reaches Austerity Limits
Aug. 2 (Bloomberg) -- FX Concepts LLC, the hedge fund that bought the euro in June just as it began a 9.7 percent surge against the dollar, now says it’s almost time to get out of the currency.
The firm, which manages $8 billion in assets, expects the euro’s advance from a four-year low on June 7 to come undone by September, partly because European austerity programs will start to weigh on growth. Reports last week that showed Spanish consumer confidence falling to the lowest level this year and banks tightening credit standards in the region suggest the budget measures may already be undermining the recovery.
The same fiscal measures that helped restore confidence in the euro may soon weaken the region’s economies and torpedo the rally. A July 30 survey of 21 money managers overseeing $1.29 trillion by Jersey City, New Jersey-based research firm Ried Thunberg ICAP Inc. found 75 percent don’t expect Europe’s common currency to strengthen over the next three months.
“Austerity is really bad for growth,” said Jonathan Clark, vice chairman at New York-based FX Concepts, the world’s biggest currency hedge fund. “In the U.S., austerity is mainly on the state level, but in Europe they are whole-hog into cutting spending to reduce deficits. Under a pessimistic scenario, the European currencies are in a lot of trouble.”
Spending Cuts
Spain, Portugal and Greece will reduce spending by an average 4.3 percent of gross domestic product from 2009 to 2011, said Gilles Moec, an economist in London at Deutsche Bank AG, Germany’s largest lender. The euro area will expand 1.5 percent this year, less than a previous estimate of 2 percent, UBS AG, the biggest Swiss bank by assets, said in a July 16 report.
The cuts contrast with the U.S., where President Barack Obama signed into law a $34 billion extension of unemployment benefits last month. The Congressional Budget Office projects a record $1.47 trillion deficit this fiscal year ending Sept. 30, and $1.42 trillion in 2011.
While U.S. growth is slowing, it beats the European Union, where a 750 billion-euro ($981 billion) backstop for the region’s most indebted nations stabilized the currency after it slid from $1.5144 on Nov. 25 to the June 7 low.
U.S. GDP grew at a 2.4 percent pace in the second quarter, compared with 3.7 percent in the prior period, the Commerce Department in Washington said July 30. Corporate spending on equipment and software jumped at a 22 percent annual rate, the biggest increase since 1997.
The median second-quarter estimate for the euro region is 1.30 percent, and 1.10 percent for the year, based on a survey of 20 economists by Bloomberg.
Budgetary ‘Zeal’
Federal Reserve Chairman Ben S. Bernanke said July 22 more fiscal stimulus is needed to support the U.S. recovery. European Central Bank President Jean-Claude Trichet is taking the opposite tack, writing in the Financial Times that industrial countries should begin addressing deficits now. The ECB meets Aug. 5, and will likely keep its key interest rate at 1 percent, according to all 51 economists surveyed by Bloomberg.
“We continue to question the sustainability of the euro’s recent rebound given the zeal with which European officials have embraced fiscal consolidation,” said Mansoor Mohi-uddin, global head of currency strategy in Singapore at UBS. The world’s second-biggest currency trader, after Deutsche Bank, predicts the euro will end this year at $1.15. “We expect the euro to face renewed downward pressure.”
Raising Estimates
The euro strengthened 1.1 percent to $1.3052 last week, capping the biggest monthly gain since May 2009. While it rallied against the greenback in the five trading days ended July 30, it was little changed based on Bloomberg Correlation- Weighted Currency Indexes, rising 0.1 percent. It gained 0.2 percent to $1.3080 today.
Rising confidence in Europe’s economy and a slowdown in the U.S. helped quell speculation the 16-nation currency union would splinter. Goldman Sachs Group Inc., Wells Fargo & Co. and at least 12 other firms raised their estimates for the euro in June or July, Bloomberg data show. The 15 percent slide in the first half also proved a boon for German exports.
The number of unemployed Germans fell in July to the lowest level since November 2008, the Federal Labor Agency in Nuremberg said July 29. The same day, an index of executive and consumer confidence in the region compiled by the European Commission in Brussels rose to the highest level since March 2008 in July.
‘Great Deal’
“Governments have done a great deal bringing stability back to the region, and that will manifest itself in a stronger euro in the longer term,” said Fabrizio Fiorini, head of fixed income at Aletti Gestielle SGR SpA in Milan.
The bears say Germany will be unable to prop up the euro much longer as the Frankfurt-based ECB’s quarterly Bank Lending Survey released July 28 showed banks tightening credit. Consumer confidence in Spain fell to minus 26 last month from minus 25 in June, while sentiment in Portugal and France matched their lows for the year, the commission said July 29.
The euro may reach $1.33 before falling along with stocks, according to Clark at FX Concepts. The median estimate of 39 strategists surveyed by Bloomberg is for it to weaken to $1.21 by year-end.
The euro “will correlate strongly with equities,” Clark said. “We are expecting equities to turn around and go down into the second quarter of next year or longer.”
The MSCI World Index advanced 8.9 percent since the euro rally began eight weeks ago.
Bond Signals
Record gains this year by longer-maturity German bonds show investors are concerned growth across Europe may wane. Securities due in 2020 and later returned 13.8 percent, the most since the euro’s introduction in 1999 and compared with 13.1 percent for similar-dated Treasuries, indexes compiled by Bloomberg and the European Federation of Financial Analysts Societies show.
“There’s still a lot of stress in the euro-zone economy,” said Shahid Ikram, deputy chief investment officer at Aviva Investors. The market is “probably viewing the debt burden as being deflationary. Any reduction in debt is likely to impinge on the potential rate of growth,” he said.
The fund management division of Britain’s second-largest insurer, which oversees $403 billion in assets, is looking for opportunities to bet the euro will weaken against the dollar, Ikram said.
Currency Options
Demand for options granting investors the right to sell the euro versus those giving the right to buy suggests eight weeks of appreciation may peter out.
The euro’s three-month option risk-reversal rate was minus 2.14 percent on July 26, approaching the most since June 29. When negative, the measure means demand for options giving the right to sell the currency is greater than demand for those that allow purchases. The rate was minus 1.71 percent today.
“The fiscal challenges facing the euro zone remain immense,” said Shaun Osborne, chief currency strategist at TD Securities Inc. in Toronto and the most accurate foreign- exchange forecaster from the end of 2008 through the first half of this year based on data compiled by Bloomberg. Osborne forecasts the currency will depreciate to $1.08 by year-end.
“The euro needs to go lower to try and help some of the fiscal bite that is going to start to have an impact on some of the more peripheral economies,” he said.
A weaker euro may help companies in the region as it boosts competitiveness and makes revenue earned overseas worth more when it’s brought home. Eni SpA, Italy’s largest oil and gas company, said July 28 second-quarter profit jumped 81 percent as crude prices climbed and the euro declined.
Gary Shilling, president of the economic research firm A. Gary Shilling & Co. in Springfield, New Jersey, has predicted the euro may drop to parity with the dollar since January. He was correct in all 13 of his investment guidelines for 2008.
“This has really just been a lull between storms in Europe,” Shilling said. “We still have a situation where the likelihood of defaults and restructuring in Greece, and probably Portugal and Spain, are still very high. That doesn’t mean they won’t be bailed out, but the turmoil that is likely to result should drive the euro lower.”
The firm, which manages $8 billion in assets, expects the euro’s advance from a four-year low on June 7 to come undone by September, partly because European austerity programs will start to weigh on growth. Reports last week that showed Spanish consumer confidence falling to the lowest level this year and banks tightening credit standards in the region suggest the budget measures may already be undermining the recovery.
The same fiscal measures that helped restore confidence in the euro may soon weaken the region’s economies and torpedo the rally. A July 30 survey of 21 money managers overseeing $1.29 trillion by Jersey City, New Jersey-based research firm Ried Thunberg ICAP Inc. found 75 percent don’t expect Europe’s common currency to strengthen over the next three months.
“Austerity is really bad for growth,” said Jonathan Clark, vice chairman at New York-based FX Concepts, the world’s biggest currency hedge fund. “In the U.S., austerity is mainly on the state level, but in Europe they are whole-hog into cutting spending to reduce deficits. Under a pessimistic scenario, the European currencies are in a lot of trouble.”
Spending Cuts
Spain, Portugal and Greece will reduce spending by an average 4.3 percent of gross domestic product from 2009 to 2011, said Gilles Moec, an economist in London at Deutsche Bank AG, Germany’s largest lender. The euro area will expand 1.5 percent this year, less than a previous estimate of 2 percent, UBS AG, the biggest Swiss bank by assets, said in a July 16 report.
The cuts contrast with the U.S., where President Barack Obama signed into law a $34 billion extension of unemployment benefits last month. The Congressional Budget Office projects a record $1.47 trillion deficit this fiscal year ending Sept. 30, and $1.42 trillion in 2011.
While U.S. growth is slowing, it beats the European Union, where a 750 billion-euro ($981 billion) backstop for the region’s most indebted nations stabilized the currency after it slid from $1.5144 on Nov. 25 to the June 7 low.
U.S. GDP grew at a 2.4 percent pace in the second quarter, compared with 3.7 percent in the prior period, the Commerce Department in Washington said July 30. Corporate spending on equipment and software jumped at a 22 percent annual rate, the biggest increase since 1997.
The median second-quarter estimate for the euro region is 1.30 percent, and 1.10 percent for the year, based on a survey of 20 economists by Bloomberg.
Budgetary ‘Zeal’
Federal Reserve Chairman Ben S. Bernanke said July 22 more fiscal stimulus is needed to support the U.S. recovery. European Central Bank President Jean-Claude Trichet is taking the opposite tack, writing in the Financial Times that industrial countries should begin addressing deficits now. The ECB meets Aug. 5, and will likely keep its key interest rate at 1 percent, according to all 51 economists surveyed by Bloomberg.
“We continue to question the sustainability of the euro’s recent rebound given the zeal with which European officials have embraced fiscal consolidation,” said Mansoor Mohi-uddin, global head of currency strategy in Singapore at UBS. The world’s second-biggest currency trader, after Deutsche Bank, predicts the euro will end this year at $1.15. “We expect the euro to face renewed downward pressure.”
Raising Estimates
The euro strengthened 1.1 percent to $1.3052 last week, capping the biggest monthly gain since May 2009. While it rallied against the greenback in the five trading days ended July 30, it was little changed based on Bloomberg Correlation- Weighted Currency Indexes, rising 0.1 percent. It gained 0.2 percent to $1.3080 today.
Rising confidence in Europe’s economy and a slowdown in the U.S. helped quell speculation the 16-nation currency union would splinter. Goldman Sachs Group Inc., Wells Fargo & Co. and at least 12 other firms raised their estimates for the euro in June or July, Bloomberg data show. The 15 percent slide in the first half also proved a boon for German exports.
The number of unemployed Germans fell in July to the lowest level since November 2008, the Federal Labor Agency in Nuremberg said July 29. The same day, an index of executive and consumer confidence in the region compiled by the European Commission in Brussels rose to the highest level since March 2008 in July.
‘Great Deal’
“Governments have done a great deal bringing stability back to the region, and that will manifest itself in a stronger euro in the longer term,” said Fabrizio Fiorini, head of fixed income at Aletti Gestielle SGR SpA in Milan.
The bears say Germany will be unable to prop up the euro much longer as the Frankfurt-based ECB’s quarterly Bank Lending Survey released July 28 showed banks tightening credit. Consumer confidence in Spain fell to minus 26 last month from minus 25 in June, while sentiment in Portugal and France matched their lows for the year, the commission said July 29.
The euro may reach $1.33 before falling along with stocks, according to Clark at FX Concepts. The median estimate of 39 strategists surveyed by Bloomberg is for it to weaken to $1.21 by year-end.
The euro “will correlate strongly with equities,” Clark said. “We are expecting equities to turn around and go down into the second quarter of next year or longer.”
The MSCI World Index advanced 8.9 percent since the euro rally began eight weeks ago.
Bond Signals
Record gains this year by longer-maturity German bonds show investors are concerned growth across Europe may wane. Securities due in 2020 and later returned 13.8 percent, the most since the euro’s introduction in 1999 and compared with 13.1 percent for similar-dated Treasuries, indexes compiled by Bloomberg and the European Federation of Financial Analysts Societies show.
“There’s still a lot of stress in the euro-zone economy,” said Shahid Ikram, deputy chief investment officer at Aviva Investors. The market is “probably viewing the debt burden as being deflationary. Any reduction in debt is likely to impinge on the potential rate of growth,” he said.
The fund management division of Britain’s second-largest insurer, which oversees $403 billion in assets, is looking for opportunities to bet the euro will weaken against the dollar, Ikram said.
Currency Options
Demand for options granting investors the right to sell the euro versus those giving the right to buy suggests eight weeks of appreciation may peter out.
The euro’s three-month option risk-reversal rate was minus 2.14 percent on July 26, approaching the most since June 29. When negative, the measure means demand for options giving the right to sell the currency is greater than demand for those that allow purchases. The rate was minus 1.71 percent today.
“The fiscal challenges facing the euro zone remain immense,” said Shaun Osborne, chief currency strategist at TD Securities Inc. in Toronto and the most accurate foreign- exchange forecaster from the end of 2008 through the first half of this year based on data compiled by Bloomberg. Osborne forecasts the currency will depreciate to $1.08 by year-end.
“The euro needs to go lower to try and help some of the fiscal bite that is going to start to have an impact on some of the more peripheral economies,” he said.
A weaker euro may help companies in the region as it boosts competitiveness and makes revenue earned overseas worth more when it’s brought home. Eni SpA, Italy’s largest oil and gas company, said July 28 second-quarter profit jumped 81 percent as crude prices climbed and the euro declined.
Gary Shilling, president of the economic research firm A. Gary Shilling & Co. in Springfield, New Jersey, has predicted the euro may drop to parity with the dollar since January. He was correct in all 13 of his investment guidelines for 2008.
“This has really just been a lull between storms in Europe,” Shilling said. “We still have a situation where the likelihood of defaults and restructuring in Greece, and probably Portugal and Spain, are still very high. That doesn’t mean they won’t be bailed out, but the turmoil that is likely to result should drive the euro lower.”
EUR/USD Weekly Technical Forecast (Aug 2-6 2010)
The rate decision stand in the center of a week full with economic indicators. Here’s an outlook for the European events and an updated technical analysis for EUR/USD.
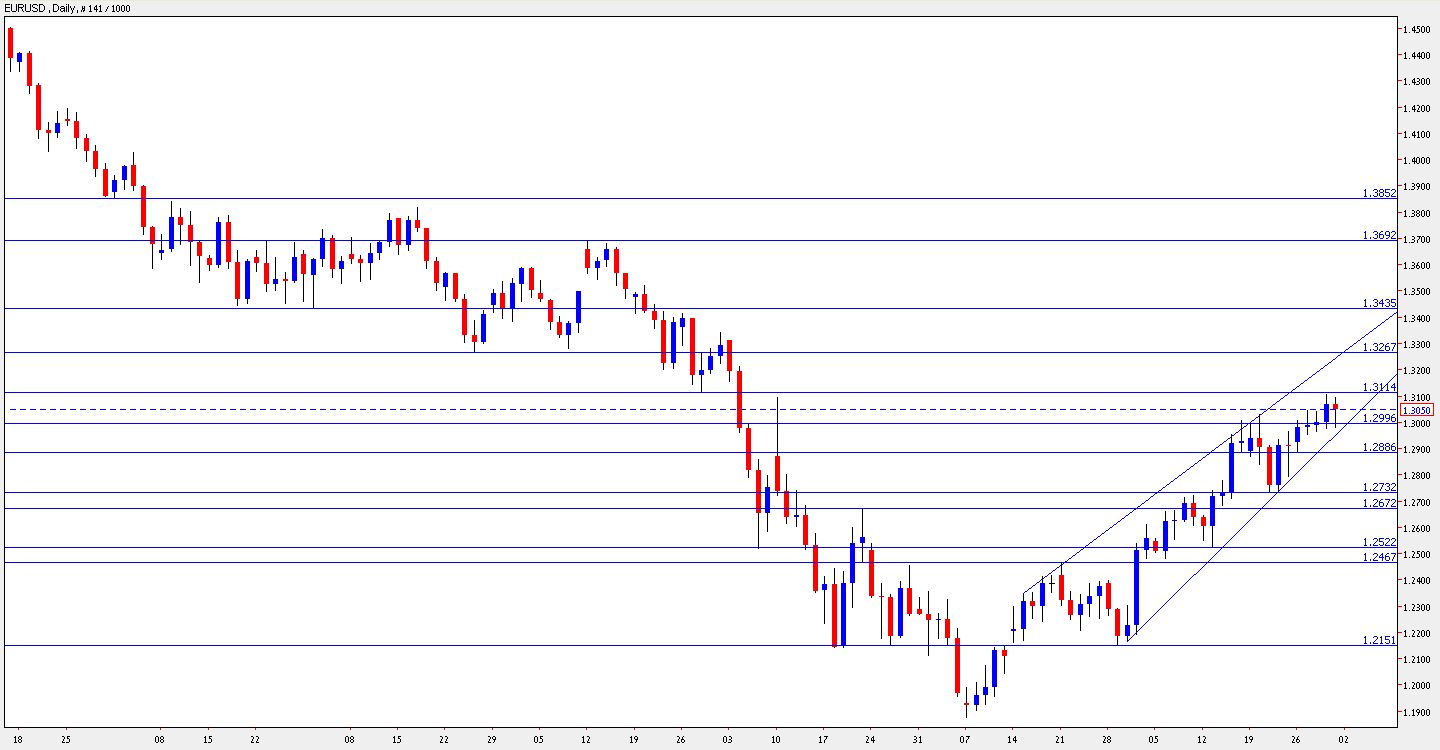
EUR/USD daily chart with support and resistance lines on it. Click to enlarge:

The Euro edged up in the past week, but did it with hesitation. It’s still too dependent on US weakness to rise. When more credit rating issues appeared in Spain, it took a breather. Will it make an impressive breakout this week, or will the rally end? Let’s start:
EUR/USD Technical Analysis
The Euro began the week by rising from the 1.2880 line towards 1.30. After struggling with strong resistance around this level, EUR/USD climbed up to 1.3107, just under the 1.3114 resistance level, before dropping and closing at 1.3050.
Most lines haven’t changed since last week’s outlook. EUR/USD is currently bound between the psychological level of 1.30 and the fierce resistance line of 1.3114 – a line that supported the pair in May, before the big collapse, and afterwards capped an attempt of recovery.
If Euro/Dollar breaks above this level, the next hurdle is 1.3267, which was a support line twice (March and April). Above, 1.3435 was also a strong line of support in February and later worked as resistance in April.
Even higher, the notable lines of resistance are at 1.37, and this is followed by the area of 1.3850 – a level last seen 6 months ago.
Looking down below 1.30, the next line is 1.2880, which held the pair in 2009 and now works as a minor line of support. Below, 1.2720 worked as a resistance line at the beginning of July and later supported the pair – it’s a strong support line now. It’s followed by 1.2672, which capped the pair in May.
Lower, 1.2520 worked as a support line several times in the past, and it’s followed by a former resistance line at 1.2460, which provides further support. There are more lines below, with 1.2150 being the most significant one down the road.
It’s also interesting to look at the pair’s uptrend channel (also in the graph. EUR/USD is currently trading within this steep channel. A break to either direction will be a signal.
I am neutral on EUR/USD.
The Euro-zone still has issues of its own. The stress tests failed to provide confidence and the unemployment rate is still very high. On the other hand, the US isn’t doing too good either. 1.3114 is the key level.
EUR/USD daily chart with support and resistance lines on it. Click to enlarge:
The Euro edged up in the past week, but did it with hesitation. It’s still too dependent on US weakness to rise. When more credit rating issues appeared in Spain, it took a breather. Will it make an impressive breakout this week, or will the rally end? Let’s start:
- Final Manufacturing PMI: Published on Monday at 8:00 GMT. Purchasing managers in Europe’s manufacturing sector were more optimistic according to the initial release, sending the score from 55.6 to 56.5 points. This will probably be confirmed now.
- PPI: Published on Tuesday at 9:00 GMT. Friday’s CPI Flash Estimate saw inflation rising at an annual pace of 1.7% – advancing but falling short of expectations. Also producer prices are expected to be on the rise – from 0.3% to 0.4%. Only a more significant rise will cause inflationary fears.
- Final Services PMI: Published on Wednesday at 8:00 GMT. Also the purchasing managers in the services sector became more optimistic – with the score rising from 55.5 to 56. It will probably be confirmed as well.
- Retail Sales: Published on Wednesday at 9:00 GMT. Germany’s retail sales were a bitter disappointment on Friday – dropping by 0.9%. The figure for whole Euro-zone is expected to follow with a drop as well, but much more modest – 0.1%. A positive number will boost the Euro.
- German Factory Orders: Published on Thursday at 10:00 GMT. After many strong months, factory order corrected with a drop last month, of 0.5%. And now, just before the rate decision, we’re expecting the positive trend to resume with a rise of 1.5%.
- Rate decision: Published on Thursday at 11:45 GMT. Jean-Claude Trichet is widely expected to leave the Minimum Bid Rate unchanged at 1%. While inflation is slightly rising, it’s still far from worrying levels (like in Britain). On the other hand, unemployment remains high in the Euro-zone, and the debt crisis is far from over. 45 minutes after the rate decision, Trichet will hold a press conference. Any comments will rock the Euro.
- German Industrial Production: Published on Friday at 10:00 GMT. Complementing the factory orders number on the previous day, this figure is also expected to be positive – with a rise here of 1.1%, continuing a positive trend of the past 3 months.
EUR/USD Technical Analysis
The Euro began the week by rising from the 1.2880 line towards 1.30. After struggling with strong resistance around this level, EUR/USD climbed up to 1.3107, just under the 1.3114 resistance level, before dropping and closing at 1.3050.
Most lines haven’t changed since last week’s outlook. EUR/USD is currently bound between the psychological level of 1.30 and the fierce resistance line of 1.3114 – a line that supported the pair in May, before the big collapse, and afterwards capped an attempt of recovery.
If Euro/Dollar breaks above this level, the next hurdle is 1.3267, which was a support line twice (March and April). Above, 1.3435 was also a strong line of support in February and later worked as resistance in April.
Even higher, the notable lines of resistance are at 1.37, and this is followed by the area of 1.3850 – a level last seen 6 months ago.
Looking down below 1.30, the next line is 1.2880, which held the pair in 2009 and now works as a minor line of support. Below, 1.2720 worked as a resistance line at the beginning of July and later supported the pair – it’s a strong support line now. It’s followed by 1.2672, which capped the pair in May.
Lower, 1.2520 worked as a support line several times in the past, and it’s followed by a former resistance line at 1.2460, which provides further support. There are more lines below, with 1.2150 being the most significant one down the road.
It’s also interesting to look at the pair’s uptrend channel (also in the graph. EUR/USD is currently trading within this steep channel. A break to either direction will be a signal.
I am neutral on EUR/USD.
The Euro-zone still has issues of its own. The stress tests failed to provide confidence and the unemployment rate is still very high. On the other hand, the US isn’t doing too good either. 1.3114 is the key level.
GBP/USD Weekly Technical Forecast (Aug 2-6 2010)
A very busy week expects cable traders, with 9 important events. The rate decision is the peak but other data will also rock the rising Pound. Here’s an outlook for the British events and an updated technical analysis for GBP/USD.
GBP/USD daily chart with support and resistance lines on it. Click to enlarge:

In the past week, Mervyn King finally ackowledged the rising inflation and sent the Pound over the tough 1.5520 resistance line, for the first time in 5 months. Will this continue? Let’s start:
GBP/USD Technical Analysis
The Pound managed to climb over the minor resistance line at the beginning of the week, and traded in a narrow range between 1.5472 and 1.5520. It finally made the breakout above this major hurdle. By the end of the week, it also made an attempt to cross 1.5720, but bounced back to close at 1.5688.
Note that some higher lines were added on last week’s outlook. The Pound now ranges between 1.5520, which turned into a strong support line, and 1.5720, which was the bottom in October 2009.
Higher, 1.5833 is a very strong line of resistance – it supported the Pound before the collapse in February, and also worked as a resistance line immediately afterwards. Higher, 1.6080 is a minor resistance line after being a swing high in February.
Even higher, 1.6270 worked as a support line when the Pound traded at higher ground, and now works as resistance. It’s followed by 1.6450.
Looking down below 1.5520, the 1.5470 line now works as minor support. It’s followed by 1.5350, a pivotal line many times in the past. Below, 1.5230 and and 1.5130 worked as support and resistance lines in July, and cushion the pair now.
Lower, 1.5050 capped a recovery attempt in May and now works as resistance. It’s followed by 1.4870, a support line in June, and 1.4780, which supported the Pound on the big collapse in May.
I continue being bullish on GBP/USD.
After getting a boost from the GDP, Mervyn King also began hinting that a rate hike will come, supplying more fuel for Pound bulls. After breaking above 1.5520, there’s still lots of room for rises.
GBP/USD daily chart with support and resistance lines on it. Click to enlarge:

In the past week, Mervyn King finally ackowledged the rising inflation and sent the Pound over the tough 1.5520 resistance line, for the first time in 5 months. Will this continue? Let’s start:
- Halifax HPI: Publication time unknown at the moment. After the Nationwide HPI disappointed with a drop of 0.5% in prices of homes, also this indicator is expected to show a drop of 0.4% – the third consecutive drop. The figure is based on the internal data of HBOS, making it very reliable. The Pound will rock with every result.
- Manufacturing PMI: Published on Monday at 8:30 GMT. According to this survey of 600 purchasing mangers in the manufacturing sector, Britain continues to grow at a stable and good pace, with the score standing at 57.5 points, high above the critical 50 point bar, meaning economic expansion. It’s expected to slightly drop to 57.1
- Construction PMI: Published on Tuesday at 8:30 GMT. Contrary to the manufacturing and services sectors, purchasing managers in the construction sector turned positive only 4 months ago, but this indicator also reached a high score of 58.4. Also here, it’s expected to edge down to 58.2 points.
- Nationwide Consumer Confidence: The Nationwide Building Society surveys 1000 consumers for this important indicator. Despite the recovery in employment, consumer confidence deteriorated in the past few months. After gradually dropping from 81 to 63 points, another slide is predicted – to 60. This indicator is highly regarded by the MPC, just before the rate decision.
- Services PMI: Published on Wednesday at 8:30 GMT. Completing the array of PMIs, the services sector isn’t doing as well as the other sectors. From a score of 54.4 (still positive), Services PMI is likely to rise to 54.8 points. This is the last indicator before the rate decision.
- Rate decision: Published on Thursday at 11:00 GMT. Official expectations for the Official Bank Rate are for an unchanged value of 0.50%. But, things are starting to move in Britain. Apart from Andrew Sentance, that already voted for a rate hike, the improving employment and fast growth in Q2, together with inflation – all call for a rate hike. We’ve also seen a change in Mervyn King’s attitude – expressing concerns from inflation for the first time. Will there finally be a hike to boost the Pound, or will it remain unchanged for an 18th time in a row? Anyway, the Pound will shake on the decision as well as on the wording of the MPC Rate Statement.
- Manufacturing Production: Published on Friday at 8:30 GMT. This important indicator rose by only 0.3% last month, after dropping on the previous month. Another rise is expected this time, and it’s expected to be at 0.6%. Note that manufacturing is around 80% of Industrial Production released at the same time (expected +0.3%), but manufacturing tends to draw attention.
- PPI: Published on Friday at 8:30 GMT. Slightly overshadowed by manufacturing production, his important inflation figure is expected to drop for a third month in a row, indicating that consumer prices could also calm down. PPI Input, the more important figure, will probably drop by 0.4%, double last month’s drop. PPI Output is expected to rise by 0.1% after falling by 0.3% last month.
- NIESR GDP Estimate: Published on Friday at 14:00 GMT. The National Institute of Economic and Social Research is known for its accurate predictions. It releases a GDP estimate every month, filling the gap of the government releases that are published only once a quarter. NIESR showed that the economy grew by 0.7% in Q2, less than the official first release. Will this be revised upwards, or will the second release by the government be revised to the downside? Anyway, we’ll get a peak at July – the first month of Q3.
GBP/USD Technical Analysis
The Pound managed to climb over the minor resistance line at the beginning of the week, and traded in a narrow range between 1.5472 and 1.5520. It finally made the breakout above this major hurdle. By the end of the week, it also made an attempt to cross 1.5720, but bounced back to close at 1.5688.
Note that some higher lines were added on last week’s outlook. The Pound now ranges between 1.5520, which turned into a strong support line, and 1.5720, which was the bottom in October 2009.
Higher, 1.5833 is a very strong line of resistance – it supported the Pound before the collapse in February, and also worked as a resistance line immediately afterwards. Higher, 1.6080 is a minor resistance line after being a swing high in February.
Even higher, 1.6270 worked as a support line when the Pound traded at higher ground, and now works as resistance. It’s followed by 1.6450.
Looking down below 1.5520, the 1.5470 line now works as minor support. It’s followed by 1.5350, a pivotal line many times in the past. Below, 1.5230 and and 1.5130 worked as support and resistance lines in July, and cushion the pair now.
Lower, 1.5050 capped a recovery attempt in May and now works as resistance. It’s followed by 1.4870, a support line in June, and 1.4780, which supported the Pound on the big collapse in May.
I continue being bullish on GBP/USD.
After getting a boost from the GDP, Mervyn King also began hinting that a rate hike will come, supplying more fuel for Pound bulls. After breaking above 1.5520, there’s still lots of room for rises.
AUD/USD Weekly Technical Forecast (Aug 2-6 2010)
A very busy week expects Aussie traders, with the rate decision standing in the limelight. Here’s an outlook for the 13 events that will rock the Aussie, and an updated technical analysis for AUD/USD.
AUD/USD daily chart with support and resistance lines on it. Click to enlarge:

The quarterly release of CPI was weak in the past week. This hurt the Aussie, as this convinced everybody that there will be no rate hike. Let’s start:
AUD/USD Technical Analysis
The Aussie rose to the area of 0.9080 at the beginning of the week, but it then fell sharply under 0.8950. A second rise also stopped at around 0.9080, making it a new resistance line (didn’t appear last week). The Aussie finally closed at 0.9043, above the psychological 0.90 line.
AUD/USD is bound in the area that it traded in the past week – between 0.8950, which was also a support line in November, and 0.9080 – the double-top in the past week.
Looking down, the next line of support is 0.8870 that capped the pair twice in June and July. After this line was broken to the upside, AUD/USD didn’t get close to it, making it a strong line.
Below, 0.8735 was the low point in December and also a line of support recently. It’s followed by 0.8660, also a minor support line in recent months, and then by 0.8567, which provided support many times in the past year, and also served as a resistance line in May.
Looking up above 0.9080, the next resistance line is quite close – 0.9135. This was a support line when the Aussie was trading higher. Above, 0.9220 had a similar role, and it works as resistance as well.
Even higher, 0.9327 held the pair 5 times in the past year, and provides strong resistance. The next lines are close – 0.9366 was a peak in April, and 0.9405 is the highest level in 2009.
I remain bullish on the Aussie
Despite the weak CPI, the Australian economy is doing great. With strong employment, AUD/USD has more room to rise.
AUD/USD daily chart with support and resistance lines on it. Click to enlarge:

The quarterly release of CPI was weak in the past week. This hurt the Aussie, as this convinced everybody that there will be no rate hike. Let’s start:
- AIG Manufacturing Index: Published on Sunday at 23:30 GMT. The Australian Industry Group published its first PMI-like index very early in the week. According to this survey of 200 manufacturers, activity slowed down in the past month from 56.3 to 52.9 points. Another drop is predicted this time, but the score will probably remain above 50 – meaning economic expansion.
- MI Inflation Gauge: Published on Monday at 00: 30 GMT. The Melbourne Institute publishes this unofficial CPI figure once a month, filling the gap for the government, which releases the consumer price index only once a quarter. Inflation slowed down to 0.3% last month and will probably be the same this time, or even lower. The official CPI was also weaker than predicted.
- HIA New Home Sales: Published on Monday. The Housing Industry Association showed a drop of 6.4% in new home sales, after a rise in a similar scale (6.2%). This volatile index will probably drop once again – the result of the rate hikes, but the scale will probably be smaller.
- Commodity Prices: Published on Monday at 6:30 GMT. This release comes a few hours after New Zealand’s similar release. Nevertheless, it always rocks the Aussie. The year over year change stood on about +43% in the past two months. A similar number is expected now.
- ANZ Job Advertisements: Published on Tuesday at 1:30 GMT. This unofficial employment gauge serves as warm up for the official job figures due 9 days later. The amount of jobs advertised in the media made a nice rise of 2.7%, going hand in hand with the improvement seen in the official figures. Another rise is expected this time. Note that two more important market-moving figure are released at the same time. They’re listed below.
- Building Approvals: Published on Tuesday at 1:30 GMT. After two sharp drops seen in previous months, the number of approvals is expected to recover with a rise of 2.1%. Note that this indicator tends to be very volatile, yet highly regarded.
- Retail Sales: Published on Tuesday at 1:30 GMT. This important consumer figure is of high importance. Three months of small rises will probably be followed by a fourth one – the volume of sales will probably rise by 0.4%, double last month’s rise.
- Rate decision: Published on Tuesday at 4:30 GMT. Three hours after the influx of three major indicators – the most important event occurs. The last rate hike from Glenn Stevens came in May, when he hiked the Cash Rate from 4.25% to 4.50%. Since then, it remained unchanged. Also now, especially after the weak CPI, the RBA doesn’t fear inflation, and will probably leave the rate unchanged. The Aussie will shake on the accompanying RBA Rate Statement, which will provide explanations for the decision.
- AIG Services Index: Published on Tuesday at 23:30 GMT. According to AIG, the services sector is contracting. The survey of 200 companies scored 48.8 points last month. A score under 50, as seen also in the previous month, means that the sector is squeezing. It’s now expected to rise and top the 50 point mark.
- Trade Balance: Published on Wednesday at 1:30 GMT. Australia enjoys a surplus in its trade balance in the past two months. Last month’s surplus, 1.65 billion, exceeded expectations by a three-fold. Another rise, to 1.81 billion, is expected now.
- HPI: Published on Wednesday at 1:30 GMT. This official house price index lags other indicators, but is of high importance due to the fact that it’s released only once per quarter. After a full year of strong rises (between 4.2% to 5.1%), a smaller rise will probably be seen this time – 2.2%.
- AIG Construction Index: Published on Thursday at 23:30 GMT. The last indicator from AIG unexpectedly fell below 50 points last month, triggering worries about this sector as well. It’s now expected to bounce back from 46.4 to above 50.
- RBA Monetary Policy Statement: Published on Friday at 1:30 GMT. This statement from the central bank continues the rate statement. It not only explains the policy, but also consists of forecasts for the upcoming months. Hints about monetary policy can also be seen here. The Aussie usually rocks on this release.
AUD/USD Technical Analysis
The Aussie rose to the area of 0.9080 at the beginning of the week, but it then fell sharply under 0.8950. A second rise also stopped at around 0.9080, making it a new resistance line (didn’t appear last week). The Aussie finally closed at 0.9043, above the psychological 0.90 line.
AUD/USD is bound in the area that it traded in the past week – between 0.8950, which was also a support line in November, and 0.9080 – the double-top in the past week.
Looking down, the next line of support is 0.8870 that capped the pair twice in June and July. After this line was broken to the upside, AUD/USD didn’t get close to it, making it a strong line.
Below, 0.8735 was the low point in December and also a line of support recently. It’s followed by 0.8660, also a minor support line in recent months, and then by 0.8567, which provided support many times in the past year, and also served as a resistance line in May.
Looking up above 0.9080, the next resistance line is quite close – 0.9135. This was a support line when the Aussie was trading higher. Above, 0.9220 had a similar role, and it works as resistance as well.
Even higher, 0.9327 held the pair 5 times in the past year, and provides strong resistance. The next lines are close – 0.9366 was a peak in April, and 0.9405 is the highest level in 2009.
I remain bullish on the Aussie
Despite the weak CPI, the Australian economy is doing great. With strong employment, AUD/USD has more room to rise.
NZD/USD Weekly Technical Forecast ( Aug 2-6 2010)
Employment figures dominate the upcoming week’s kiwi trading. Here’s an outlook for the events in New Zealand and an updated technical analysis for NZD/USD.
NZD/USD daily chart with support and resistance lines on it. Click to enlarge:
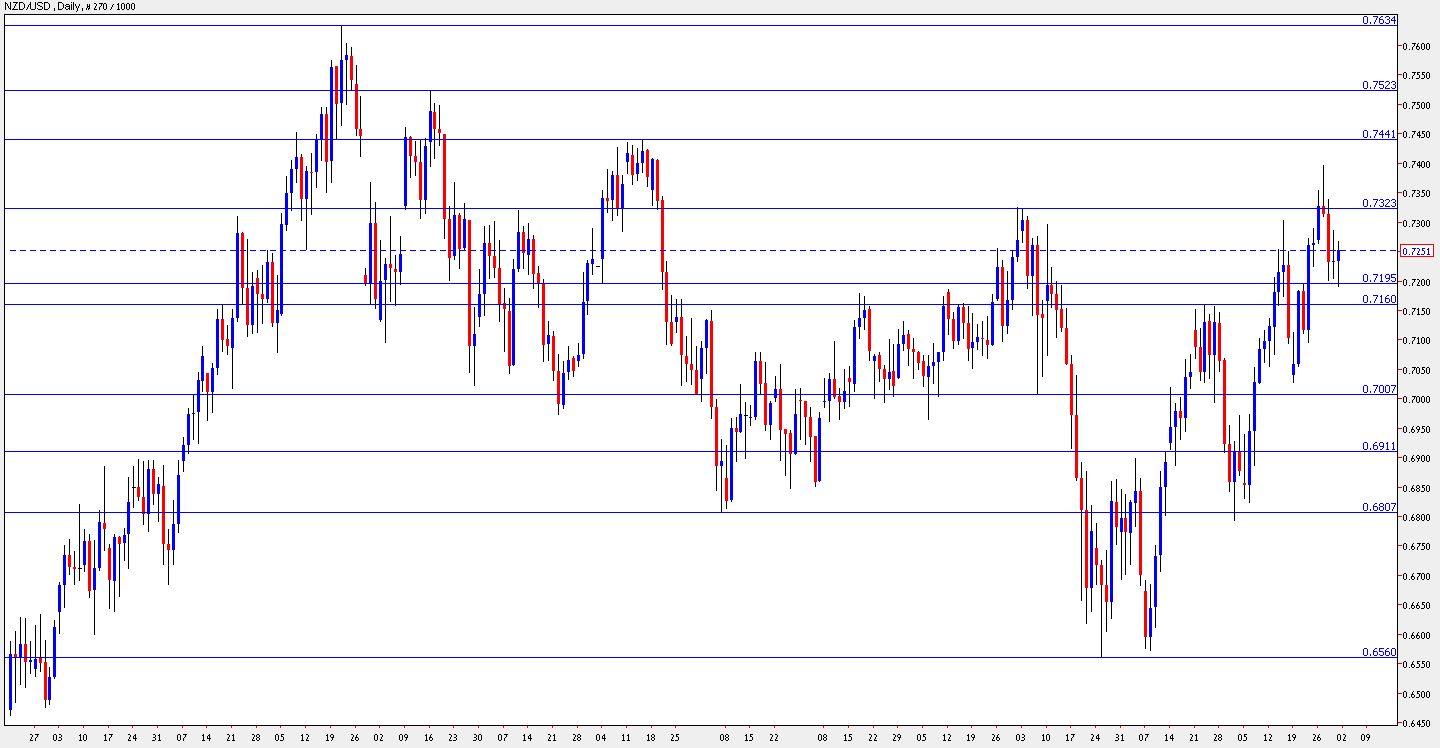
The kiwi reached new highs in the past week, on top of the expected rate hike, but it didn’t hold on to these gains. It now depends on the employment figures, which will have a long-term effect on the pair. Let’s start:
- ANZ Commodity Prices: Published on Monday at 3:00 GMT. This time, the release of commodity prices is released just before the similar Australian release, making it more significant. Last month saw the first drop in prices in 16 months, and this hurt the kiwi. But after a drop of 1.2% last month, prices are expected to rise this time.
- Labor Cost Index: Published on Monday at 22:45 GMT. This major quarterly index is an interesting combination of inflation and employment, being a great warm up for the employment figures. After two consecutive quarters of rises in a scale of 0.3% – the cost of labor will probably rise by 0.4% this time.
- Employment data: Published on Wednesday at 22:45 GMT. Employment figures always shake the markets. In New Zealand, the effect is more significant, as these figures are published only once per quarter. The last release was superb – unemployment change jumped by 1%, and the unemployment rate made a steep drop from 7.1% to 6%, boosting both the kiwi and the Aussie. But this quarter won’t be that good – employment is expected to rise by only 0.5% and the unemployment rate is predicted to rise from 6% to 6.2% – still OK.
NZD/USD Technical Analysis
The kiwi rose gradually and then made a sharp move above the 0.7325 resistance line. This was short lived – after peaking just under 0.74, NZD/USD dropped back down and found support at 0.72, before closing at 07250.
Most of the lines haven’t changed since last week’s outlook. NZD/USD is bound once again between 0.72, a round number that worked in both directions and 0.7325 which capped the pair in May.
Above, 0.7440 was a stubborn peak at the beginning of the year, and also the place where the pair fell from in October 2009. Higher, 0.7523 was a peak in November and now works as resistance. This is followed by 0.7634, the highest level since the outbreak of the financial crisis.
Below, 0.72, the next line of support is very close, at 0.7160 – which worked as resistance in June. The round number of 0.70 provides the next support line.
Lower, 0.6910 capped the pair in May and now works as a line of resistance. It’s followed by 0.68. There are many lines below, with the most notable one being 0.6560, the 2010 low.
I remain bullish on NZD/USD.
With a higher interest rate, and with an expected rise in employment, the kiwi has more room to rise.
USD/CAD Weekly Technical Forecast (Aug 2-6 2010)
The loonie will move on US data during most of the week, but the busy end of the week promises tension. Here’s an outlook for the Canadian events, and an updated technical analysis for USD/CAD.
USD/CAD daily chart with support and resistance lines on it. Click to enlarge:

Canada’s monthly GDP rose by 0.1%, exactly as expected, and kept USD/CAD rather stable. Will we see another jump in employment?
- Building Permits: Published on Thursday at 12:30 GMT. This important housing figure is very volatile. It fell by double digits last month (10.8%), but it’s important to remember that it made a similar leap three months ago (12.2%). It’s now expected to rise by a very modest 0.6% – expect surprises. This always shakes the loonie.
- Employment data: Published on Friday at 11:00 GMT. After a huge leap of 93,200 jobs last month, a very modest rise of 10,300 jobs is expected this time, in the employment change figure. The unemployment rate, which unexpectedly dropped to 7.9% is expected to stay unchanged this time. The timing, 90 minutes before the American Non-Farm Payrolls, always promises action on USD/CAD, even if the Canadian figures will indeed be tame as expected.
- Ivey PMI: Published on Friday at 14:00 GMT. The week isn’t over for the loonie. The Richard Ivey Business School has a major PMI number to end the week. From a good score of 58.9 points, the score is predicted to edge down to 56.3 – still above 50, meaning economic expansion.
USD/CAD Technical Analysis
This week’s trading was dominated by a tight range – 1.0280 to 1.04. Two false breakouts were seen to the downside – USD/CAD went as low as 1.0256 but quickly returned to the range, and closed at 1.0291.
Most lines haven’t changed since last week’s outlook. The same range continues into the next week. 1.04 was the long term bottom border of the 1.04 to 1.0750 range, and now works as a tough resistance line. Above, 1.0550 capped the pair several times in the past, and is a minor line of resistance.
The next line of resistance is at 1.0680, which capped the pair in June and several times in July. Apart from being the long term top border of the range, 1.0750 was also tested in May. Even higher, 1.0850 was a swing high in 2009 and a swing high in May as well.
Looking down below 1.0280, the 2009 low of 1.02 is the next line of support. Note that it also worked as resistance after the pair hit parity in April. Lower, 1.01 is a minor line of resistance, and it’s followed by the ultimate support line – parity.
I remain bearish on USD/CAD.
The improving Canadian economy, rising interest rate and fresh jobs data should boost the loonie. Also note that a breakout of oil prices above $80 per barrel will fuel the Canadian dollar.
Subscribe to:
Posts (Atom)