Showing posts with label survey. Show all posts

Saturday, July 10, 2010

AUD/USD Weekly Technical Forecast (July 12-16 2010)


A variety of Australian releases and one Chinese release will move the Aussie in the upcoming week. Here’s an outlook for the Australian events, and an updated technical analysis for AUD/USD, now in higher ground.

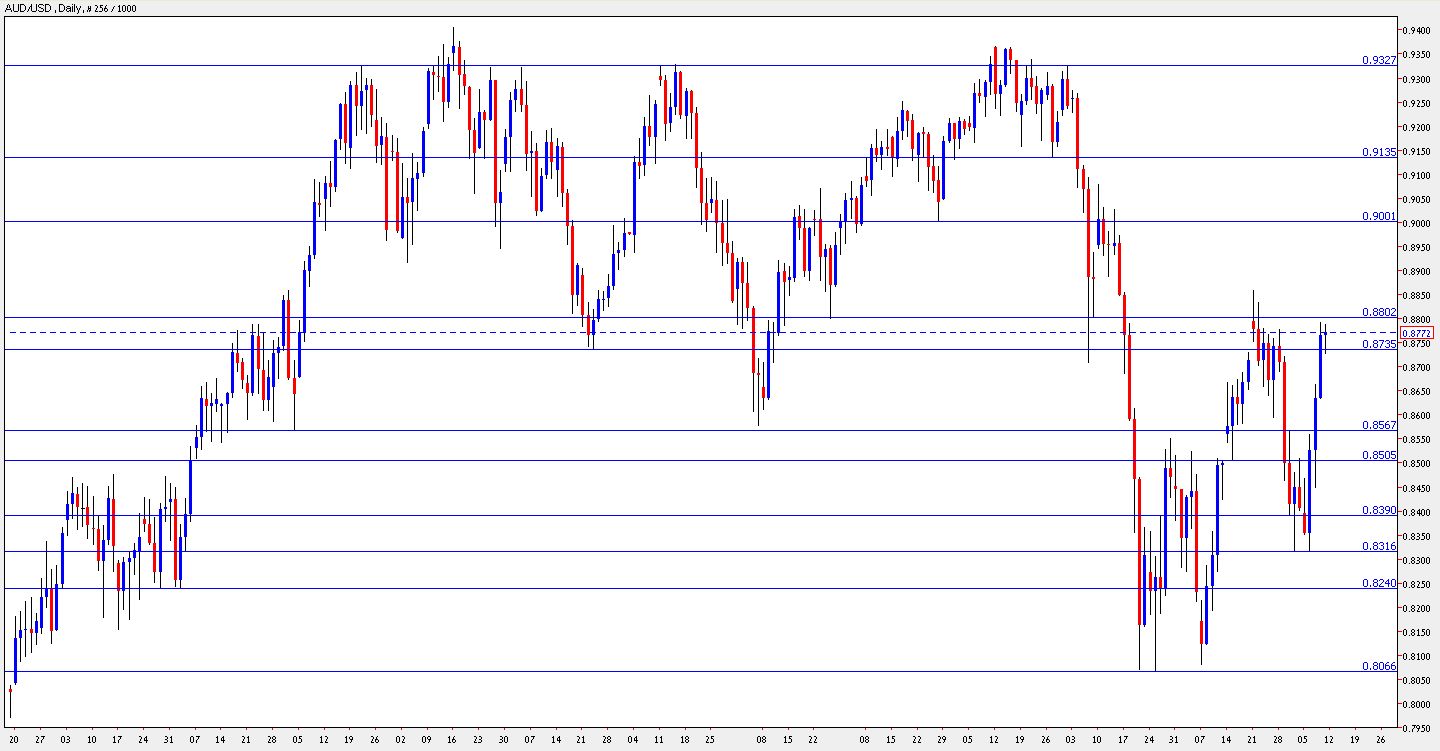
AUD/USD daily chart with support and resistance lines. Click to enlarge:
aud usd forecast

The Australian economy enjoys a bubbling job market. The fresh figures came out significantly better than expected, and this gave a big boost to AUD/USD. Will this continue? Let’s start:

  1. Home Loans: Published on Monday at 1:30 GMT. This important housing indicator reflects the impact of the rate hikes – less people are taking loans due to the high interest rate. After 7 consecutive months of drops, the number of loans is finally expected to rise, but at a very modest scale – 0.1%. This will provide a shaky start for AUD/USD at the beginning of the new week.

  2. NAB Business Confidence: Published on Tuesday at 1:30 GMT. National Australia Bank has shown a significant drop in business confidence in the past three months – a drop from 19 to 5 points, although still positive, still showing optimism. This survey of 350 businesses will probably show another drop this time.

  3. Westpac Consumer Sentiment: Published on Wednesday at 1:30 GMT. Westpac’s survey deals with the consumers. 1,200 consumers have shown less confidence in the past three months, with sharp drops of 5.7% and 7% in the past two months. This time, a small rise is expected.

  4. MI Inflation Expectations: Published on Thursday at 1:30 GMT. The Melbourne Institute fills in for the gap created by the government, that publishes the CPI only once per quarter. According to MI, inflation is now weaker – 3.4% in comparison to a strong 4.1% figure three months ago. A drop under 3% will weaken the Aussie.

  5. New Motor Vehicle Sales: Published on Thursday at 1:30 GMT. Vehicle sales are a strong indicator of consumption, but this indicator tends to be very volatile. After a rise of 8.4% two months ago, a drop of 3.2% was seen last month. A small rise is predicted now.

  6. Chinese GDP: Published on Thursday at 2:00 GMT. Australia’s main partner continued to grow rapidly while the West suffered from economic contraction. In the past two quarters, the growth rate return to double digits: 10.5% in Q4 of 2009 and 11.9% in Q1. China releases the figures for Q2 quite early. They’re expected to show a growth rate of 10.5%, still very strong. The Aussie will gain from a stronger rise.


AUD/USD Technical Analysis

The Aussie had a bad start to the week, testing the 0.8315 support line, which it also tested in the previous week. It then began a rally during which it broke many resistance lines and eventually bounced at the resistance line 0f 0.88.

The Aussie is now in a tight range between 0.8735 (December’s low) and the round number of 0.88 which it just tested. Note that some lines have changed since last week’s outlook.

Below 0.8735, the next support line is 0.8567, which served as a strong support line during many months in the past year, and recently worked as a pivotal line. Below, 0.8505 is a minor support line.

Lower, 0.8390 worked as a minor support line in recent months. It’s followed by 0.8315, which was a double bottom in the past two weeks – this makes it a strong line of support now.

Even lower, 0.8240 is an old line of resistance that now serves as a support line, and its followed by the year-to-date low of 0.8066.

Looking up above 0.88, the next line of resistance is the round number of 0.90, which was tested in March and in May. Higher, 0.9327 is a very strong line of resistance which held the Aussie back lots of times in the past year.

Even higher, 0.94 was the 2009 high and its followed by the round number of 0.95, but they’re still far.

I remain bullish on the Aussie.

Once again, we’ve seen that the Australia is doing great – the economy gained lots of jobs. We’ll now probably see that Australia’s main trade partner, China, is also doing well, and this is likely to provide further strength for the Aussie.

AUD/USD Weekly Technical Forecast (July 12-16 2010)


A variety of Australian releases and one Chinese release will move the Aussie in the upcoming week. Here’s an outlook for the Australian events, and an updated technical analysis for AUD/USD, now in higher ground.

AUD/USD daily chart with support and resistance lines. Click to enlarge:

aud usd forecast

The Australian economy enjoys a bubbling job market. The fresh figures came out significantly better than expected, and this gave a big boost to AUD/USD. Will this continue? Let’s start:

  1. Home Loans: Published on Monday at 1:30 GMT. This important housing indicator reflects the impact of the rate hikes – less people are taking loans due to the high interest rate. After 7 consecutive months of drops, the number of loans is finally expected to rise, but at a very modest scale – 0.1%. This will provide a shaky start for AUD/USD at the beginning of the new week.

  2. NAB Business Confidence: Published on Tuesday at 1:30 GMT. National Australia Bank has shown a significant drop in business confidence in the past three months – a drop from 19 to 5 points, although still positive, still showing optimism. This survey of 350 businesses will probably show another drop this time.

  3. Westpac Consumer Sentiment: Published on Wednesday at 1:30 GMT. Westpac’s survey deals with the consumers. 1,200 consumers have shown less confidence in the past three months, with sharp drops of 5.7% and 7% in the past two months. This time, a small rise is expected.

  4. MI Inflation Expectations: Published on Thursday at 1:30 GMT. The Melbourne Institute fills in for the gap created by the government, that publishes the CPI only once per quarter. According to MI, inflation is now weaker – 3.4% in comparison to a strong 4.1% figure three months ago. A drop under 3% will weaken the Aussie.

  5. New Motor Vehicle Sales: Published on Thursday at 1:30 GMT. Vehicle sales are a strong indicator of consumption, but this indicator tends to be very volatile. After a rise of 8.4% two months ago, a drop of 3.2% was seen last month. A small rise is predicted now.

  6. Chinese GDP: Published on Thursday at 2:00 GMT. Australia’s main partner continued to grow rapidly while the West suffered from economic contraction. In the past two quarters, the growth rate return to double digits: 10.5% in Q4 of 2009 and 11.9% in Q1. China releases the figures for Q2 quite early. They’re expected to show a growth rate of 10.5%, still very strong. The Aussie will gain from a stronger rise.


AUD/USD Technical Analysis

The Aussie had a bad start to the week, testing the 0.8315 support line, which it also tested in the previous week. It then began a rally during which it broke many resistance lines and eventually bounced at the resistance line 0f 0.88.

The Aussie is now in a tight range between 0.8735 (December’s low) and the round number of 0.88 which it just tested. Note that some lines have changed since last week’s outlook.

Below 0.8735, the next support line is 0.8567, which served as a strong support line during many months in the past year, and recently worked as a pivotal line. Below, 0.8505 is a minor support line.

Lower, 0.8390 worked as a minor support line in recent months. It’s followed by 0.8315, which was a double bottom in the past two weeks – this makes it a strong line of support now.

Even lower, 0.8240 is an old line of resistance that now serves as a support line, and its followed by the year-to-date low of 0.8066.

Looking up above 0.88, the next line of resistance is the round number of 0.90, which was tested in March and in May. Higher, 0.9327 is a very strong line of resistance which held the Aussie back lots of times in the past year.

Even higher, 0.94 was the 2009 high and its followed by the round number of 0.95, but they’re still far.

I remain bullish on the Aussie.

Once again, we’ve seen that the Australia is doing great – the economy gained lots of jobs. We’ll now probably see that Australia’s main trade partner, China, is also doing well, and this is likely to provide further strength for the Aussie.
NZD/USD Weekly Technical Forecast (July 12-16 2010)


Retail sales and the all-important CPI are the major events that will rock the kiwi this week. Here’s an outlook for the events in New Zealand, and an updated technical analysis for NZD/USD.

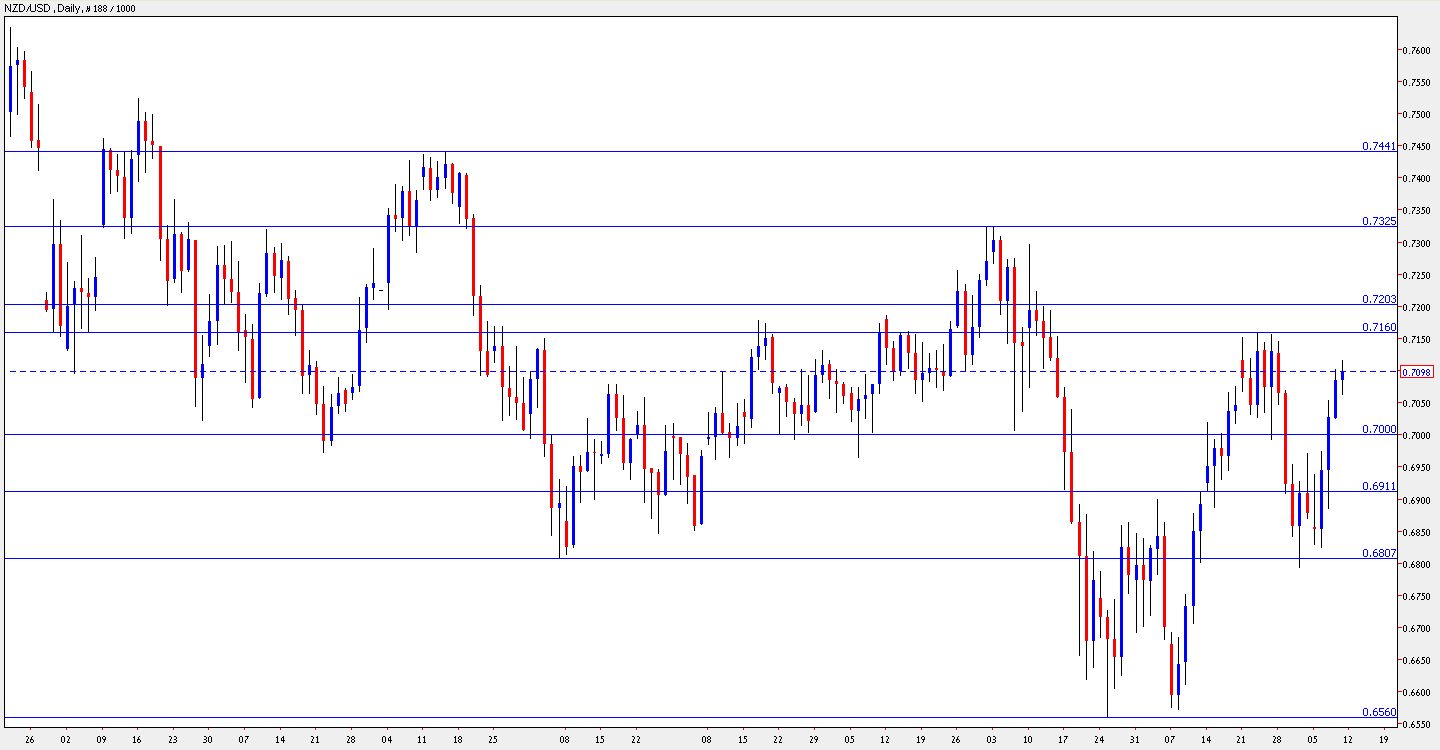
NZD/USD daily chart with support and resistance lines. Click to enlarge:

nzd usd forecast

The kiwi advanced after crossing the round number of 0.70. It’s further steps depend now on inflation, which will determine the outcome of the next rate decision. Let’s start:

  1. FPI: Published on Monday at 22:45 GMT. This monthly gap fills the gap that the government creates by releasing inflation figures only once per quarter. The prices of food, which fell in the past two months, is expected to rise this time. This will be an indicator for the CPI released later in the week.

  2. Retail Sales: Published on Tuesday at 22:45 GMT. Consumers disappointed in the past three months. Sales grew less than expected, or fell more than expected. This important indicator hurt the kiwi. After a drop of 0.6% last month, a rise of 0.6% is predicted now. Also note core retail sales, which fell by 0.2% and are likely to rise by 0.6% now. We’ve seen a strong impact when retail sales fell two months ago.

  3. Business NZ Manufacturing Index: Published on Wednesday at 22:30 GMT. This survey of manufacturers fell from the peak it reached two months ago and dropped from 58.6 to 54.5 points. Another drop is expected now, but the number will probably remain above 50, meaning economic expansion.

  4. CPI: Published on Thursday at 22:45 GMT. A rise in the consumer price index is the key to an intense tightening cycle by the central bank, that already began. Last quarter’s rise of 0.4% will probably be followed by a rise of 0.5% this time. A jump above 1% will boost the kiwi.


NZD/USD Technical Analysis

The kiwi continued struggling with the 0.6910 line at the beginning of the week, but then made a strong move upwards and broke above the round number of 0.70 to close just under 0.71.

NZD/USD’s range is between the round support line of 0.70 and the next resistance line of 0.7160, which was a stubborn top during June. The next line of resistance is at 0.72, which capped the kiwi in the past.

Higher, May’s highs of 0.7325 provide the next strong resistance line. This was an area of resistance also in December. The last line of resistance is at 0.7440, which was a peak at the beginning of the year.

Looking down below 0.70, 0.6910 provides the next support line. It has been a pivotal line recently. Lower, 0.68 provides support very recently and also in February, and is the next line of support.

There are many lines below, but the most notable one is 0.6560, which was the year-to-date low.

I remain bullish on the kiwi.

With a stable, growing economy, and with a cycle of rate hikes that already began, it’s likely to gradually rise.

NZD/USD Weekly Technical Forecast (July 12-16 2010)


Retail sales and the all-important CPI are the major events that will rock the kiwi this week. Here’s an outlook for the events in New Zealand, and an updated technical analysis for NZD/USD.

NZD/USD daily chart with support and resistance lines. Click to enlarge:

nzd usd forecast

The kiwi advanced after crossing the round number of 0.70. It’s further steps depend now on inflation, which will determine the outcome of the next rate decision. Let’s start:

  1. FPI: Published on Monday at 22:45 GMT. This monthly gap fills the gap that the government creates by releasing inflation figures only once per quarter. The prices of food, which fell in the past two months, is expected to rise this time. This will be an indicator for the CPI released later in the week.

  2. Retail Sales: Published on Tuesday at 22:45 GMT. Consumers disappointed in the past three months. Sales grew less than expected, or fell more than expected. This important indicator hurt the kiwi. After a drop of 0.6% last month, a rise of 0.6% is predicted now. Also note core retail sales, which fell by 0.2% and are likely to rise by 0.6% now. We’ve seen a strong impact when retail sales fell two months ago.

  3. Business NZ Manufacturing Index: Published on Wednesday at 22:30 GMT. This survey of manufacturers fell from the peak it reached two months ago and dropped from 58.6 to 54.5 points. Another drop is expected now, but the number will probably remain above 50, meaning economic expansion.

  4. CPI: Published on Thursday at 22:45 GMT. A rise in the consumer price index is the key to an intense tightening cycle by the central bank, that already began. Last quarter’s rise of 0.4% will probably be followed by a rise of 0.5% this time. A jump above 1% will boost the kiwi.


NZD/USD Technical Analysis

The kiwi continued struggling with the 0.6910 line at the beginning of the week, but then made a strong move upwards and broke above the round number of 0.70 to close just under 0.71.

NZD/USD’s range is between the round support line of 0.70 and the next resistance line of 0.7160, which was a stubborn top during June. The next line of resistance is at 0.72, which capped the kiwi in the past.

Higher, May’s highs of 0.7325 provide the next strong resistance line. This was an area of resistance also in December. The last line of resistance is at 0.7440, which was a peak at the beginning of the year.

Looking down below 0.70, 0.6910 provides the next support line. It has been a pivotal line recently. Lower, 0.68 provides support very recently and also in February, and is the next line of support.

There are many lines below, but the most notable one is 0.6560, which was the year-to-date low.

I remain bullish on the kiwi.

With a stable, growing economy, and with a cycle of rate hikes that already began, it’s likely to gradually rise.