Showing posts with label rally. Show all posts

Saturday, July 10, 2010

AUD/USD Weekly Technical Forecast (July 12-16 2010)


A variety of Australian releases and one Chinese release will move the Aussie in the upcoming week. Here’s an outlook for the Australian events, and an updated technical analysis for AUD/USD, now in higher ground.

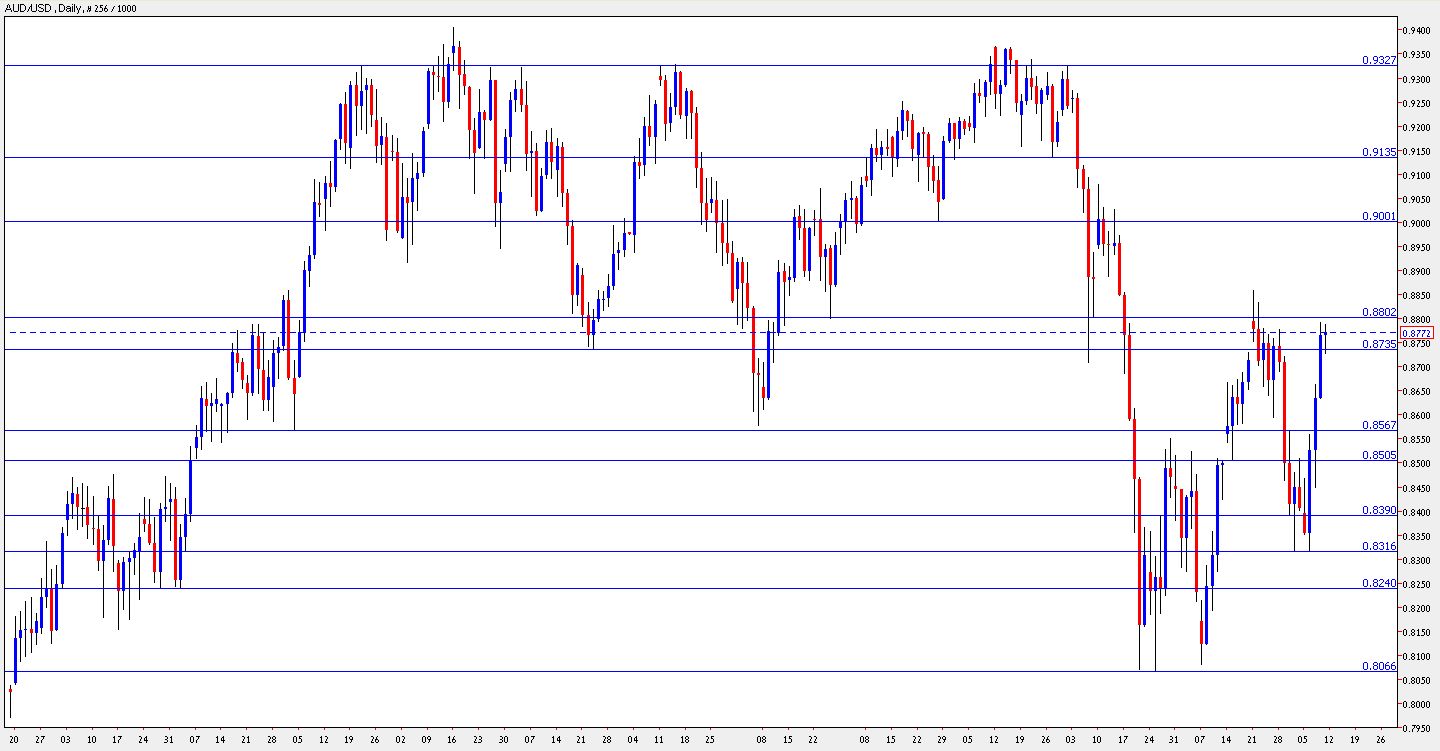
AUD/USD daily chart with support and resistance lines. Click to enlarge:
aud usd forecast

The Australian economy enjoys a bubbling job market. The fresh figures came out significantly better than expected, and this gave a big boost to AUD/USD. Will this continue? Let’s start:

  1. Home Loans: Published on Monday at 1:30 GMT. This important housing indicator reflects the impact of the rate hikes – less people are taking loans due to the high interest rate. After 7 consecutive months of drops, the number of loans is finally expected to rise, but at a very modest scale – 0.1%. This will provide a shaky start for AUD/USD at the beginning of the new week.

  2. NAB Business Confidence: Published on Tuesday at 1:30 GMT. National Australia Bank has shown a significant drop in business confidence in the past three months – a drop from 19 to 5 points, although still positive, still showing optimism. This survey of 350 businesses will probably show another drop this time.

  3. Westpac Consumer Sentiment: Published on Wednesday at 1:30 GMT. Westpac’s survey deals with the consumers. 1,200 consumers have shown less confidence in the past three months, with sharp drops of 5.7% and 7% in the past two months. This time, a small rise is expected.

  4. MI Inflation Expectations: Published on Thursday at 1:30 GMT. The Melbourne Institute fills in for the gap created by the government, that publishes the CPI only once per quarter. According to MI, inflation is now weaker – 3.4% in comparison to a strong 4.1% figure three months ago. A drop under 3% will weaken the Aussie.

  5. New Motor Vehicle Sales: Published on Thursday at 1:30 GMT. Vehicle sales are a strong indicator of consumption, but this indicator tends to be very volatile. After a rise of 8.4% two months ago, a drop of 3.2% was seen last month. A small rise is predicted now.

  6. Chinese GDP: Published on Thursday at 2:00 GMT. Australia’s main partner continued to grow rapidly while the West suffered from economic contraction. In the past two quarters, the growth rate return to double digits: 10.5% in Q4 of 2009 and 11.9% in Q1. China releases the figures for Q2 quite early. They’re expected to show a growth rate of 10.5%, still very strong. The Aussie will gain from a stronger rise.


AUD/USD Technical Analysis

The Aussie had a bad start to the week, testing the 0.8315 support line, which it also tested in the previous week. It then began a rally during which it broke many resistance lines and eventually bounced at the resistance line 0f 0.88.

The Aussie is now in a tight range between 0.8735 (December’s low) and the round number of 0.88 which it just tested. Note that some lines have changed since last week’s outlook.

Below 0.8735, the next support line is 0.8567, which served as a strong support line during many months in the past year, and recently worked as a pivotal line. Below, 0.8505 is a minor support line.

Lower, 0.8390 worked as a minor support line in recent months. It’s followed by 0.8315, which was a double bottom in the past two weeks – this makes it a strong line of support now.

Even lower, 0.8240 is an old line of resistance that now serves as a support line, and its followed by the year-to-date low of 0.8066.

Looking up above 0.88, the next line of resistance is the round number of 0.90, which was tested in March and in May. Higher, 0.9327 is a very strong line of resistance which held the Aussie back lots of times in the past year.

Even higher, 0.94 was the 2009 high and its followed by the round number of 0.95, but they’re still far.

I remain bullish on the Aussie.

Once again, we’ve seen that the Australia is doing great – the economy gained lots of jobs. We’ll now probably see that Australia’s main trade partner, China, is also doing well, and this is likely to provide further strength for the Aussie.

AUD/USD Weekly Technical Forecast (July 12-16 2010)


A variety of Australian releases and one Chinese release will move the Aussie in the upcoming week. Here’s an outlook for the Australian events, and an updated technical analysis for AUD/USD, now in higher ground.

AUD/USD daily chart with support and resistance lines. Click to enlarge:

aud usd forecast

The Australian economy enjoys a bubbling job market. The fresh figures came out significantly better than expected, and this gave a big boost to AUD/USD. Will this continue? Let’s start:

  1. Home Loans: Published on Monday at 1:30 GMT. This important housing indicator reflects the impact of the rate hikes – less people are taking loans due to the high interest rate. After 7 consecutive months of drops, the number of loans is finally expected to rise, but at a very modest scale – 0.1%. This will provide a shaky start for AUD/USD at the beginning of the new week.

  2. NAB Business Confidence: Published on Tuesday at 1:30 GMT. National Australia Bank has shown a significant drop in business confidence in the past three months – a drop from 19 to 5 points, although still positive, still showing optimism. This survey of 350 businesses will probably show another drop this time.

  3. Westpac Consumer Sentiment: Published on Wednesday at 1:30 GMT. Westpac’s survey deals with the consumers. 1,200 consumers have shown less confidence in the past three months, with sharp drops of 5.7% and 7% in the past two months. This time, a small rise is expected.

  4. MI Inflation Expectations: Published on Thursday at 1:30 GMT. The Melbourne Institute fills in for the gap created by the government, that publishes the CPI only once per quarter. According to MI, inflation is now weaker – 3.4% in comparison to a strong 4.1% figure three months ago. A drop under 3% will weaken the Aussie.

  5. New Motor Vehicle Sales: Published on Thursday at 1:30 GMT. Vehicle sales are a strong indicator of consumption, but this indicator tends to be very volatile. After a rise of 8.4% two months ago, a drop of 3.2% was seen last month. A small rise is predicted now.

  6. Chinese GDP: Published on Thursday at 2:00 GMT. Australia’s main partner continued to grow rapidly while the West suffered from economic contraction. In the past two quarters, the growth rate return to double digits: 10.5% in Q4 of 2009 and 11.9% in Q1. China releases the figures for Q2 quite early. They’re expected to show a growth rate of 10.5%, still very strong. The Aussie will gain from a stronger rise.


AUD/USD Technical Analysis

The Aussie had a bad start to the week, testing the 0.8315 support line, which it also tested in the previous week. It then began a rally during which it broke many resistance lines and eventually bounced at the resistance line 0f 0.88.

The Aussie is now in a tight range between 0.8735 (December’s low) and the round number of 0.88 which it just tested. Note that some lines have changed since last week’s outlook.

Below 0.8735, the next support line is 0.8567, which served as a strong support line during many months in the past year, and recently worked as a pivotal line. Below, 0.8505 is a minor support line.

Lower, 0.8390 worked as a minor support line in recent months. It’s followed by 0.8315, which was a double bottom in the past two weeks – this makes it a strong line of support now.

Even lower, 0.8240 is an old line of resistance that now serves as a support line, and its followed by the year-to-date low of 0.8066.

Looking up above 0.88, the next line of resistance is the round number of 0.90, which was tested in March and in May. Higher, 0.9327 is a very strong line of resistance which held the Aussie back lots of times in the past year.

Even higher, 0.94 was the 2009 high and its followed by the round number of 0.95, but they’re still far.

I remain bullish on the Aussie.

Once again, we’ve seen that the Australia is doing great – the economy gained lots of jobs. We’ll now probably see that Australia’s main trade partner, China, is also doing well, and this is likely to provide further strength for the Aussie.

Wednesday, July 7, 2010

EUR/USD Pusing Forward to Touch 1.27..

EUR/USD continued pushing forward and touched 1.27. At this point, it seems that the heights aren’t easy for the pair, that still carries debt issues and gloomy forecasts. Update on this pair.

Euro/Dollar continued the trend that began with the weak Non-Farm Payrolls on Friday and gradually edged up during the week – from the support line of 1.2460, it rose in waves and reached 1.2702, breaking 30 pips above the 1.2672 peak it reached on May 21, in the recovery rally that followed the turmoil.

So, at this point, the highest since the beginning of May, the pair seems exhausted. EUR/USD fell back down to 1.2660 after reaching the new highs. The break seems false and the next line of resistance, 1.2880 is out of reach. 1.2880 was a support line in May 2009.

Below 1.2460, support appears at 1.2330, 1.2250 and most importantly 1.2150. Above, 1.3110 is the next resistance line.

Reasons for Euro rally

The recent Euro rally came on top of weak economic figures in the US, and especially the Non-Farm Payrolls, that disappointed two months in a row. The sentiment is that the US economic recovery is much weaker than expected, meaning low interest rates for a very extended period of time. With a weak US economy, how can the dollar rise?

But there’s something else: the risk factor. The Euro didn’t rally on its own strength, but on US weakness. US weakness is global weakness, and this will eventually trigger risk aversive trading.

The situation in the Euro-zone isn’t good. The European teams might be good football / soccer, but their economies aren’t doing well.

Top economists say that the worst is yet to come:
Shaun Osborne, chief currency strategist at TD Securities Inc. in Toronto, said the euro will depreciate to $1.13 in the third quarter, $1.08 by year-end and may near $1 in 2011 before recovering. Osborne, whose predictions were within 4.1 percent of the mark on average, according to data compiled by Bloomberg, was echoed by the nine following most-accurate forecasters in anticipating a lower euro in the next two quarters.

When fear will return to the markets, the Euro will suffer. The dollar and the yen will rise. So, if you’re enjoying this current risk rally, you better watch out before the tables turn once again.

Saturday, June 12, 2010

Fundamental Analysis On Forex Trading

It has become imperative for every forex trader to learn how to predict the price trend and which method or software is the best.

When you do forex trading, it is very important to understand the difference between fundamental analysis and technical analysis. A quick explanation of the difference among the two types of analysis is: fundamental analysis focuses on money policy, government policy and economic indicators such as GDP, exports, imports etc within a business cycle framework while technical analysis focuses on price action and market behavior, especially on chart and technical indicators.

Needless to say both schools are equally disparaging about the other, and both believe their techniques are infinitely superior. But the reality is that it has become increasingly difficult to be a purist of either persuasion. Fundamentalists need to keep an eye on the various signals derived from the price action on charts, while few technicians can afford to completely ignore impending economic data, critical political decisions or the myriad of societal issues that influence prices.

Generally speaking, fundamental analysis can only judge which direction the market will move, and technical analysis can supply both direction and rough currency rate.

Keeping in mind that the financial underpinnings of any country, trading bloc or multinational industry takes into account many factors, including social, political and economic influences, staying on top of an extremely fluid fundamental picture can be challenging. Meanwhile, forecasting models are as numerous and varied as the traders and market buffs that create them. Different people can look at the exact same data and come up with two completely different conclusions about how the market will be influenced by it. At the end, some may make huge profit and some lose their money. You can not say fundamental analysis is easy.

Remember, fundamental analysis is a very effective way to forecast economic conditions, but not necessarily exact market prices. For example, when analyzing an economist's forecast of the upcoming GDP or employment report, you begin to get a fairly clear picture of the general health of the economy and the forces at work behind it. However, you'll need to come up with a precise method as to how best to translate this information into entry and exit points for a particular trading strategy.

Tip: If you are new to do forex trading and do not trade frequently, you can mainly use fundamental analysis for your trading.

Don't disturb yourself by information overload. Sometimes traders fall into this trap and are unable to pull the trigger on a trade. Normally, your first feel is the answer for you to do forex trading. At that time, you are sure which currency is strong and which country's economy is good. The more simple, the more useful.

However, trading a particular market without knowing a great deal about the exact nature of its underlying elements is unbelievable. You might get lucky and snare a few on occasion but it's not the best approach over the long haul.

For forex traders, the fundamentals are everything that makes a country tick. From interest rates and central bank policy to natural disasters, the fundamentals are a dynamic mix of distinct plans, erratic behaviors and unforeseen events. Therefore, it is very important to understand fundamental analysis and use them on forex trading.

Related Blogs

Sunday, May 30, 2010

GBP/USD Weekly Technical Analysis (May 31- June 04 2010)

The British Pound is closely tied to the Euro, and didn’t manage to close higher. The upcoming week has many important events that will shake the Pound. Here’s an outlook for those events and an updated technical analysis for GBP/USD.

GBP/USD graph with support and resistance lines marked. Click to enlarge:


Britain’s growth rate for the first quarter of 2010 was upgraded to 0.3%, but this didn’t seem to help the Pound. After a bank holiday on Monday, we have British figures coming in every day. Let’s start:
Halifax HPI: Publication time unknown at the moment. This is a highly regarded house price index, as HBOS calculates the changes in prices using its wide internal data. After many months of rises, prices became more unstable. A drop in prices three months ago was followed by a neat rise, but last month’s drop undermined the thought that the drop wasn’t a one time event. The forecast is for a small rise of 0.3%.
Manufacturing PMI: Published on Tuesday at 8:30 GMT. Purchasin managers in Britain’s manufacturing sector are quite optimistic – the index rose to 58 points last month – the highest level sine the outbreak of the financial crisis, and it also beat expectations. This survey of 600 managers is likely to drop this time, but remain above 50 – the line that separates optimism and pessimism.
Net Lending to Individuals: Published on Wednesday at 8:30 GMT. After a few strong months, the Bank of England showed that borrowing dropped to 0.6 billion, from the highs of 2 billion. This indicates a more cautious attitude from consumers. This trend will probably continue, and a negative figure won’t be surprising.
Construction PMI: Published on Wednesday at 8:30 GMT. The second purchasing managers’ release for this week concerns the housing sector. Also here, a big leap was seen last month to 58.2 points. These numbers follow many months of scores under 50, so this fast jump might be followed with a downside correction.
Nationwide HPI: Published on Thursday at 6:00 GMT. This important house price index fell only in one month and then returned to strong rises. This is different than the Halifax HPI. But this time, prices are expected to rise by only 0.5%, half of last month’s rise.
Services PMI: Published on Thursday at 8:30 GMT. The last PMI figure is different from the first two. It fell in the past two months, and isn’t at record numbers anymore. From 55.3 points last month, the forecast is for a small rise to 55.6 points.

GBP/USD Technical Analysis

Cable began the week with a dip towards this year’s low of 1.4227, but remained far enough. A rally sent all the way to 1.4611, but these gains didn’t hold, and the pair closed at 1.4451, not far from last week’s close.

Some lines have changed since last week’s outlook. The Pound’s range is now between 1.44, a minor support line, and 1.4520, a pivotal line in the past week. It’s quite far from stronger lines.

Looking up, the stubborn peak of 1.4611 provides the next resistance line for the pair. This is followed by 1.4780, a very important line that stopped the previous collapse of the Pound, and now works as a resistance line.

Higher, 1.4975 is another minor line, and it’s followed by 1.5140, which worked as a strong support line, before the recent collapse. The next lines are 1.5350 and 1.5520, but they’re quite far away now.

Looking down, the 2010 low of 1.4227 is a strong line of support. It was approached several times, and wasn’t breached. Not yet. The next support line is quite close – 1.4130, serving as a support line at the beginning of 2009.

Even lower, 1.38 also worked as a support line at the beginning of 2009. Below, 1.3514 is the ultimate line of support, being the lowest level in over two decades. This is still very far.

I remain bearish on GBP/USD.

The European debt issues have a very strong impact on Britain. The Pound will probably suffer from the deteriorating situation. The contagious disease is on the doorstep of the UK.

GBP/USD Weekly Technical Analysis (May 31- June 04 2010)

The British Pound is closely tied to the Euro, and didn’t manage to close higher. The upcoming week has many important events that will shake the Pound. Here’s an outlook for those events and an updated technical analysis for GBP/USD.

GBP/USD graph with support and resistance lines marked. Click to enlarge:


Britain’s growth rate for the first quarter of 2010 was upgraded to 0.3%, but this didn’t seem to help the Pound. After a bank holiday on Monday, we have British figures coming in every day. Let’s start:
Halifax HPI: Publication time unknown at the moment. This is a highly regarded house price index, as HBOS calculates the changes in prices using its wide internal data. After many months of rises, prices became more unstable. A drop in prices three months ago was followed by a neat rise, but last month’s drop undermined the thought that the drop wasn’t a one time event. The forecast is for a small rise of 0.3%.
Manufacturing PMI: Published on Tuesday at 8:30 GMT. Purchasin managers in Britain’s manufacturing sector are quite optimistic – the index rose to 58 points last month – the highest level sine the outbreak of the financial crisis, and it also beat expectations. This survey of 600 managers is likely to drop this time, but remain above 50 – the line that separates optimism and pessimism.
Net Lending to Individuals: Published on Wednesday at 8:30 GMT. After a few strong months, the Bank of England showed that borrowing dropped to 0.6 billion, from the highs of 2 billion. This indicates a more cautious attitude from consumers. This trend will probably continue, and a negative figure won’t be surprising.
Construction PMI: Published on Wednesday at 8:30 GMT. The second purchasing managers’ release for this week concerns the housing sector. Also here, a big leap was seen last month to 58.2 points. These numbers follow many months of scores under 50, so this fast jump might be followed with a downside correction.
Nationwide HPI: Published on Thursday at 6:00 GMT. This important house price index fell only in one month and then returned to strong rises. This is different than the Halifax HPI. But this time, prices are expected to rise by only 0.5%, half of last month’s rise.
Services PMI: Published on Thursday at 8:30 GMT. The last PMI figure is different from the first two. It fell in the past two months, and isn’t at record numbers anymore. From 55.3 points last month, the forecast is for a small rise to 55.6 points.

GBP/USD Technical Analysis

Cable began the week with a dip towards this year’s low of 1.4227, but remained far enough. A rally sent all the way to 1.4611, but these gains didn’t hold, and the pair closed at 1.4451, not far from last week’s close.

Some lines have changed since last week’s outlook. The Pound’s range is now between 1.44, a minor support line, and 1.4520, a pivotal line in the past week. It’s quite far from stronger lines.

Looking up, the stubborn peak of 1.4611 provides the next resistance line for the pair. This is followed by 1.4780, a very important line that stopped the previous collapse of the Pound, and now works as a resistance line.

Higher, 1.4975 is another minor line, and it’s followed by 1.5140, which worked as a strong support line, before the recent collapse. The next lines are 1.5350 and 1.5520, but they’re quite far away now.

Looking down, the 2010 low of 1.4227 is a strong line of support. It was approached several times, and wasn’t breached. Not yet. The next support line is quite close – 1.4130, serving as a support line at the beginning of 2009.

Even lower, 1.38 also worked as a support line at the beginning of 2009. Below, 1.3514 is the ultimate line of support, being the lowest level in over two decades. This is still very far.

I remain bearish on GBP/USD.

The European debt issues have a very strong impact on Britain. The Pound will probably suffer from the deteriorating situation. The contagious disease is on the doorstep of the UK.

USD/CAD Weekly Technical Analysis and Trade (May 31-June 4 2010)

Weekly
Last Candlesticks pattern: Doji
Time of formation: 19 Mar 2009
Trend bias: Down

Daily
Last Candlesticks pattern: Shooting star
Time of formation: 25 May 2010
Trend bias: Sideways

Although the greenback rallied according to our expectation, reached our indicated upside target at 1.0750, however, the currency pair ran into heavy offers just below indicated previous resistance at 1.0871 and retreated sharply from there, leaving a ‘shooting star’ candlestick pattern on the daily chart and the subsequent black candle signals a top has been formed there and a week of consolidation is in store with downside bias for retracement to the Kijun-Sen (now at 1.0407) and possibly the Ichimoku cloud top (now at 1.0344) but reckon support at 1.0246 would hold from here.

On the upside, whilst recovery to 1.0590/00 cannot be ruled out, reckon 1.0705/10 would hold and bring such a correction. A daily close above 1.0750 would revive our bullishness for another rise to 1.0854-71 resistance area but it is necessary to see a sustained breach above there to encourage for retracement of medium term downtrend to 1.1000.

Recommendation: Sell towards 1.0600 for 1.0350 with stop below 1.0720.


On the weekly chart, although the currency pair rose in line with our expectation in our previous update, as price failed to close above the Ichimoku cloud bottom and retreated sharply from 1.0854 (a shooting star was formed), suggesting the rebound from0.9931 has formed a temporary top there and consolidation would be seen with mild downside bias for weakness to the convergence of the Tenkan-Sen and Kijun-Sen (now both at 1.0392) but reckon 1.0246 minor support would limit downside and key level at 1.0110 should remain intact, bring another rally next month.

On the upside, recovery is likely to be limited to 1.0700 and bring such a retreat. Only a weekly close above the Ichimoku cloud bottom (now at 1.0782) would revive bullishness and breach of resistance area at 1.0854-71 would bring retracement of medium term downtrend from 1.3066 to 1.1129 (38.2% Fibonacci retracement).

USD/CAD Weekly Technical Analysis and Trade (May 31-June 4 2010)

Weekly
Last Candlesticks pattern: Doji
Time of formation: 19 Mar 2009
Trend bias: Down

Daily
Last Candlesticks pattern: Shooting star
Time of formation: 25 May 2010
Trend bias: Sideways

Although the greenback rallied according to our expectation, reached our indicated upside target at 1.0750, however, the currency pair ran into heavy offers just below indicated previous resistance at 1.0871 and retreated sharply from there, leaving a ‘shooting star’ candlestick pattern on the daily chart and the subsequent black candle signals a top has been formed there and a week of consolidation is in store with downside bias for retracement to the Kijun-Sen (now at 1.0407) and possibly the Ichimoku cloud top (now at 1.0344) but reckon support at 1.0246 would hold from here.

On the upside, whilst recovery to 1.0590/00 cannot be ruled out, reckon 1.0705/10 would hold and bring such a correction. A daily close above 1.0750 would revive our bullishness for another rise to 1.0854-71 resistance area but it is necessary to see a sustained breach above there to encourage for retracement of medium term downtrend to 1.1000.

Recommendation: Sell towards 1.0600 for 1.0350 with stop below 1.0720.


On the weekly chart, although the currency pair rose in line with our expectation in our previous update, as price failed to close above the Ichimoku cloud bottom and retreated sharply from 1.0854 (a shooting star was formed), suggesting the rebound from0.9931 has formed a temporary top there and consolidation would be seen with mild downside bias for weakness to the convergence of the Tenkan-Sen and Kijun-Sen (now both at 1.0392) but reckon 1.0246 minor support would limit downside and key level at 1.0110 should remain intact, bring another rally next month.

On the upside, recovery is likely to be limited to 1.0700 and bring such a retreat. Only a weekly close above the Ichimoku cloud bottom (now at 1.0782) would revive bullishness and breach of resistance area at 1.0854-71 would bring retracement of medium term downtrend from 1.3066 to 1.1129 (38.2% Fibonacci retracement).

AUD/USD Weekly Technical Analysis (May 31- June 4 2010)

A very busy week expects Aussie traders: a rate decision, the GDP release and 11 more events will shake the Australian dollar. Here’s an outlook for the Australian events and an updated technical analysis for AUD/USD.

AUD/USD graph with support and resistance lines marked. Click to enlarge:


The Australian dollar enjoyed a significant recovery this week, finally dropping the Euro’s weight on the global markets. The crowded Australian calendar means that this trend will continue. Let’s start:
HIA New Home Sales: Publication time unknown at the moment. Australia’s Housing Industry Association finally provided a stable change in the number of newly constructed homes last month. The rise of 0.9% followed a drop of 5.2% and a rise of 9.5% beforehand. The forecast is for a small rise that will help the Aussie.
MI Inflation Gauge: Published on Monday at 12:30 GMT. Melbourne Institute’s inflation gauge completes the gap that the government leaves by releasing the CPI figures only once per quarter. Prices have risen by 0.4% last month, and this modest rise will probably be repeated.
Current Account: Published on Monday at 1:30 GMT. Although this figure lags the related trade balance release, this quarterly figure  still has a strong impact on currencies. Australia’s deficit rose to 17.5 billion in Q4, and is now expected to show a smaller deficit of 16.4 billion.
Private Sector Credit: Published on Monday at 1:30 GMT. Businesses and consumers increased their credit by 0.5% last month, a higher rate than in previous months, indicating economic expansion. Forecasts stand on a 0.5% rise.
AIG Manufacturing Index: Published on Monday at 23:30 GMT. The Australia Industry Group showed a big improvement in the manufacturing sector last month – this PMI-like figure rose to 59.8, a level unseen since the beginning of the global crisis. The 200 manufacturers that are surveyed for this indicator will probably show a drop, but a figure above 50 – more economic expansion.
Chinese Manufacturing PMI: Published on Tuesday at 1:00 GMT. Australia’s main trade partner is expected to show a similar score this time – 55.5 points. Any leap or drop in this major Chinese indicator will rock the Aussie as well.
Retail Sales: Published on Tuesday at 1:30 GMT. After a big drop two months ago, consumers increased their spending once again – sales volume rose by 0.3% and is expected to rise by the same scale once again.
Building Approvals: Published on Tuesday at 1:30 GMT and overshadowed by retail sales. After two months of big drops, this major housing sector gauge leaped by 15.3%. This volatile indicator will probably show another correction – to the downside this time, with a drop of 4.9%.
Rate decision: Published on Tuesday at 4:30 GMT. After two surprising rate hikes, Glenn Stevens’ RBA is expected to pause before another rate hike. The hikes succeeded in cooling down the housing sector, and the global turmoil in May create a consensus that Australia’s Cash Rate will remain at 4.5%. There are no other forecasts for this Australian rate decision.
Commodity Prices: Published on Tuesday at 6:30 GMT. Australia’s commodity oriented economy saw a big year-over-year jump in prices last month – 29.4%. It’s hard to tell where prices will go this time, making the release more important this time. On one hand, gold reached new highs, but oil prices slumped.
GDP: Published on Wednesday at 1:30 GMT. The Australian economy, that never experienced an official recession, is expected to show slower growth in Q1 – only 0.6%, after a strong 0.9% rise last time. This major indicator will shake the markets, no matter the outcome.
AIG Services Index: Published on Thursday at 23:30 GMT. The second release from AIG is different. Contrary to the manufacturing sector, Australia’s services sector returned to expansion just last month, following three months of contraction. The index rose above 50 to 52.3 points. A similar score is predicted this time.
Trade Balance: Published on Thursday at 1:30 GMT. This figure relates to April. Forecasts are positive this time. Australia is expected to see a drop in its deficit – from 2 billion to 770 million. This significant change will probably boost the Aussie.

AUD/USD Technical Analysis

The Aussie challenged the 0.8066 support line once again, but bounced off it and began a rally. After struggling with the 0.8240 resistance line, it rose up to 0.8550 before closing at 0.8477.

The current range for AUD/USD is between the minor resistance line of 0.8477, which was a strong line of resistance last year, and with 0.8240 which had a similar role.

Looking down, strong support is found at 0.8066, a line that was added on last week’s outlook. Further below, 0.7860 was a support line back in July 2009, and it’s followed by the important support line of 0.77. AUD/USD fell off this line with a big gap at the height of the financial crisis. Lower, 0.7450 is the line the Aussie fell to in those dark days.

Looking up, 0.8567, which provided support for many months, is now a strong resistance line. It’s followed by 0.88, that also was a line of support, and with 0.90, which is also a round psychological number.

Higher, 0.9135 supported the Aussie before the big collapse. It’s followed by 0.9327, which was a line of resistance lots of times in recent months.

I am bullish on AUD/USD.

The Aussie returned to enjoy its strong fundamentals, and take less hits from risk aversive trading. This busy week should provide more fuel for the Aussie to rise.

AUD/USD Weekly Technical Analysis (May 31- June 4 2010)

A very busy week expects Aussie traders: a rate decision, the GDP release and 11 more events will shake the Australian dollar. Here’s an outlook for the Australian events and an updated technical analysis for AUD/USD.

AUD/USD graph with support and resistance lines marked. Click to enlarge:


The Australian dollar enjoyed a significant recovery this week, finally dropping the Euro’s weight on the global markets. The crowded Australian calendar means that this trend will continue. Let’s start:
HIA New Home Sales: Publication time unknown at the moment. Australia’s Housing Industry Association finally provided a stable change in the number of newly constructed homes last month. The rise of 0.9% followed a drop of 5.2% and a rise of 9.5% beforehand. The forecast is for a small rise that will help the Aussie.
MI Inflation Gauge: Published on Monday at 12:30 GMT. Melbourne Institute’s inflation gauge completes the gap that the government leaves by releasing the CPI figures only once per quarter. Prices have risen by 0.4% last month, and this modest rise will probably be repeated.
Current Account: Published on Monday at 1:30 GMT. Although this figure lags the related trade balance release, this quarterly figure  still has a strong impact on currencies. Australia’s deficit rose to 17.5 billion in Q4, and is now expected to show a smaller deficit of 16.4 billion.
Private Sector Credit: Published on Monday at 1:30 GMT. Businesses and consumers increased their credit by 0.5% last month, a higher rate than in previous months, indicating economic expansion. Forecasts stand on a 0.5% rise.
AIG Manufacturing Index: Published on Monday at 23:30 GMT. The Australia Industry Group showed a big improvement in the manufacturing sector last month – this PMI-like figure rose to 59.8, a level unseen since the beginning of the global crisis. The 200 manufacturers that are surveyed for this indicator will probably show a drop, but a figure above 50 – more economic expansion.
Chinese Manufacturing PMI: Published on Tuesday at 1:00 GMT. Australia’s main trade partner is expected to show a similar score this time – 55.5 points. Any leap or drop in this major Chinese indicator will rock the Aussie as well.
Retail Sales: Published on Tuesday at 1:30 GMT. After a big drop two months ago, consumers increased their spending once again – sales volume rose by 0.3% and is expected to rise by the same scale once again.
Building Approvals: Published on Tuesday at 1:30 GMT and overshadowed by retail sales. After two months of big drops, this major housing sector gauge leaped by 15.3%. This volatile indicator will probably show another correction – to the downside this time, with a drop of 4.9%.
Rate decision: Published on Tuesday at 4:30 GMT. After two surprising rate hikes, Glenn Stevens’ RBA is expected to pause before another rate hike. The hikes succeeded in cooling down the housing sector, and the global turmoil in May create a consensus that Australia’s Cash Rate will remain at 4.5%. There are no other forecasts for this Australian rate decision.
Commodity Prices: Published on Tuesday at 6:30 GMT. Australia’s commodity oriented economy saw a big year-over-year jump in prices last month – 29.4%. It’s hard to tell where prices will go this time, making the release more important this time. On one hand, gold reached new highs, but oil prices slumped.
GDP: Published on Wednesday at 1:30 GMT. The Australian economy, that never experienced an official recession, is expected to show slower growth in Q1 – only 0.6%, after a strong 0.9% rise last time. This major indicator will shake the markets, no matter the outcome.
AIG Services Index: Published on Thursday at 23:30 GMT. The second release from AIG is different. Contrary to the manufacturing sector, Australia’s services sector returned to expansion just last month, following three months of contraction. The index rose above 50 to 52.3 points. A similar score is predicted this time.
Trade Balance: Published on Thursday at 1:30 GMT. This figure relates to April. Forecasts are positive this time. Australia is expected to see a drop in its deficit – from 2 billion to 770 million. This significant change will probably boost the Aussie.

AUD/USD Technical Analysis

The Aussie challenged the 0.8066 support line once again, but bounced off it and began a rally. After struggling with the 0.8240 resistance line, it rose up to 0.8550 before closing at 0.8477.

The current range for AUD/USD is between the minor resistance line of 0.8477, which was a strong line of resistance last year, and with 0.8240 which had a similar role.

Looking down, strong support is found at 0.8066, a line that was added on last week’s outlook. Further below, 0.7860 was a support line back in July 2009, and it’s followed by the important support line of 0.77. AUD/USD fell off this line with a big gap at the height of the financial crisis. Lower, 0.7450 is the line the Aussie fell to in those dark days.

Looking up, 0.8567, which provided support for many months, is now a strong resistance line. It’s followed by 0.88, that also was a line of support, and with 0.90, which is also a round psychological number.

Higher, 0.9135 supported the Aussie before the big collapse. It’s followed by 0.9327, which was a line of resistance lots of times in recent months.

I am bullish on AUD/USD.

The Aussie returned to enjoy its strong fundamentals, and take less hits from risk aversive trading. This busy week should provide more fuel for the Aussie to rise.