
Showing posts with label sentiment. Show all posts
Showing posts with label sentiment. Show all posts
Saturday, September 11, 2010


Saturday, July 10, 2010
AUD/USD Weekly Technical Forecast (July 12-16 2010)
A variety of Australian releases and one Chinese release will move the Aussie in the upcoming week. Here’s an outlook for the Australian events, and an updated technical analysis for AUD/USD, now in higher ground.
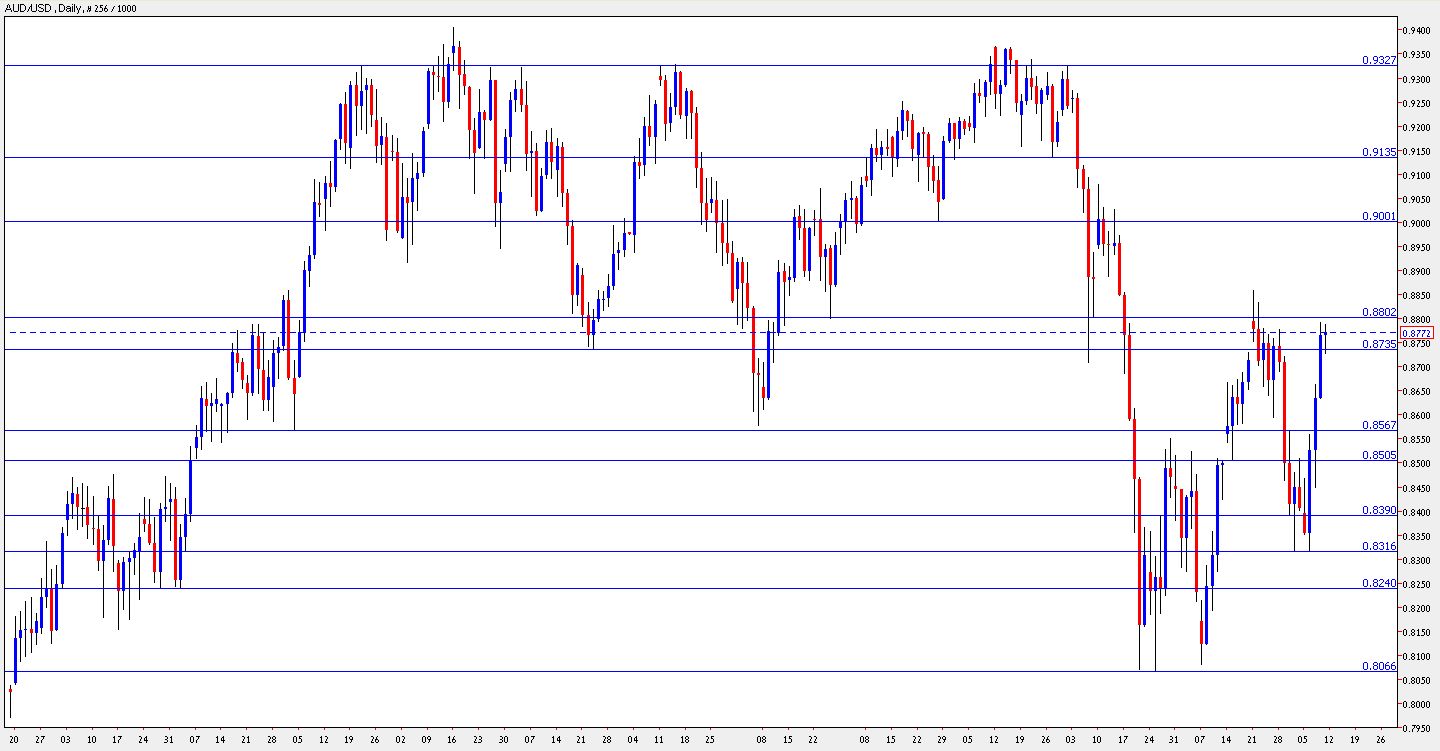
AUD/USD daily chart with support and resistance lines. Click to enlarge:
The Australian economy enjoys a bubbling job market. The fresh figures came out significantly better than expected, and this gave a big boost to AUD/USD. Will this continue? Let’s start:
- Home Loans: Published on Monday at 1:30 GMT. This important housing indicator reflects the impact of the rate hikes – less people are taking loans due to the high interest rate. After 7 consecutive months of drops, the number of loans is finally expected to rise, but at a very modest scale – 0.1%. This will provide a shaky start for AUD/USD at the beginning of the new week.
- NAB Business Confidence: Published on Tuesday at 1:30 GMT. National Australia Bank has shown a significant drop in business confidence in the past three months – a drop from 19 to 5 points, although still positive, still showing optimism. This survey of 350 businesses will probably show another drop this time.
- Westpac Consumer Sentiment: Published on Wednesday at 1:30 GMT. Westpac’s survey deals with the consumers. 1,200 consumers have shown less confidence in the past three months, with sharp drops of 5.7% and 7% in the past two months. This time, a small rise is expected.
- MI Inflation Expectations: Published on Thursday at 1:30 GMT. The Melbourne Institute fills in for the gap created by the government, that publishes the CPI only once per quarter. According to MI, inflation is now weaker – 3.4% in comparison to a strong 4.1% figure three months ago. A drop under 3% will weaken the Aussie.
- New Motor Vehicle Sales: Published on Thursday at 1:30 GMT. Vehicle sales are a strong indicator of consumption, but this indicator tends to be very volatile. After a rise of 8.4% two months ago, a drop of 3.2% was seen last month. A small rise is predicted now.
- Chinese GDP: Published on Thursday at 2:00 GMT. Australia’s main partner continued to grow rapidly while the West suffered from economic contraction. In the past two quarters, the growth rate return to double digits: 10.5% in Q4 of 2009 and 11.9% in Q1. China releases the figures for Q2 quite early. They’re expected to show a growth rate of 10.5%, still very strong. The Aussie will gain from a stronger rise.
AUD/USD Technical Analysis
The Aussie had a bad start to the week, testing the 0.8315 support line, which it also tested in the previous week. It then began a rally during which it broke many resistance lines and eventually bounced at the resistance line 0f 0.88.
The Aussie is now in a tight range between 0.8735 (December’s low) and the round number of 0.88 which it just tested. Note that some lines have changed since last week’s outlook.
Below 0.8735, the next support line is 0.8567, which served as a strong support line during many months in the past year, and recently worked as a pivotal line. Below, 0.8505 is a minor support line.
Lower, 0.8390 worked as a minor support line in recent months. It’s followed by 0.8315, which was a double bottom in the past two weeks – this makes it a strong line of support now.
Even lower, 0.8240 is an old line of resistance that now serves as a support line, and its followed by the year-to-date low of 0.8066.
Looking up above 0.88, the next line of resistance is the round number of 0.90, which was tested in March and in May. Higher, 0.9327 is a very strong line of resistance which held the Aussie back lots of times in the past year.
Even higher, 0.94 was the 2009 high and its followed by the round number of 0.95, but they’re still far.
I remain bullish on the Aussie.
Once again, we’ve seen that the Australia is doing great – the economy gained lots of jobs. We’ll now probably see that Australia’s main trade partner, China, is also doing well, and this is likely to provide further strength for the Aussie.
AUD/USD Weekly Technical Forecast (July 12-16 2010)
A variety of Australian releases and one Chinese release will move the Aussie in the upcoming week. Here’s an outlook for the Australian events, and an updated technical analysis for AUD/USD, now in higher ground.
AUD/USD daily chart with support and resistance lines. Click to enlarge:
The Australian economy enjoys a bubbling job market. The fresh figures came out significantly better than expected, and this gave a big boost to AUD/USD. Will this continue? Let’s start:
- Home Loans: Published on Monday at 1:30 GMT. This important housing indicator reflects the impact of the rate hikes – less people are taking loans due to the high interest rate. After 7 consecutive months of drops, the number of loans is finally expected to rise, but at a very modest scale – 0.1%. This will provide a shaky start for AUD/USD at the beginning of the new week.
- NAB Business Confidence: Published on Tuesday at 1:30 GMT. National Australia Bank has shown a significant drop in business confidence in the past three months – a drop from 19 to 5 points, although still positive, still showing optimism. This survey of 350 businesses will probably show another drop this time.
- Westpac Consumer Sentiment: Published on Wednesday at 1:30 GMT. Westpac’s survey deals with the consumers. 1,200 consumers have shown less confidence in the past three months, with sharp drops of 5.7% and 7% in the past two months. This time, a small rise is expected.
- MI Inflation Expectations: Published on Thursday at 1:30 GMT. The Melbourne Institute fills in for the gap created by the government, that publishes the CPI only once per quarter. According to MI, inflation is now weaker – 3.4% in comparison to a strong 4.1% figure three months ago. A drop under 3% will weaken the Aussie.
- New Motor Vehicle Sales: Published on Thursday at 1:30 GMT. Vehicle sales are a strong indicator of consumption, but this indicator tends to be very volatile. After a rise of 8.4% two months ago, a drop of 3.2% was seen last month. A small rise is predicted now.
- Chinese GDP: Published on Thursday at 2:00 GMT. Australia’s main partner continued to grow rapidly while the West suffered from economic contraction. In the past two quarters, the growth rate return to double digits: 10.5% in Q4 of 2009 and 11.9% in Q1. China releases the figures for Q2 quite early. They’re expected to show a growth rate of 10.5%, still very strong. The Aussie will gain from a stronger rise.
AUD/USD Technical Analysis
The Aussie had a bad start to the week, testing the 0.8315 support line, which it also tested in the previous week. It then began a rally during which it broke many resistance lines and eventually bounced at the resistance line 0f 0.88.
The Aussie is now in a tight range between 0.8735 (December’s low) and the round number of 0.88 which it just tested. Note that some lines have changed since last week’s outlook.
Below 0.8735, the next support line is 0.8567, which served as a strong support line during many months in the past year, and recently worked as a pivotal line. Below, 0.8505 is a minor support line.
Lower, 0.8390 worked as a minor support line in recent months. It’s followed by 0.8315, which was a double bottom in the past two weeks – this makes it a strong line of support now.
Even lower, 0.8240 is an old line of resistance that now serves as a support line, and its followed by the year-to-date low of 0.8066.
Looking up above 0.88, the next line of resistance is the round number of 0.90, which was tested in March and in May. Higher, 0.9327 is a very strong line of resistance which held the Aussie back lots of times in the past year.
Even higher, 0.94 was the 2009 high and its followed by the round number of 0.95, but they’re still far.
I remain bullish on the Aussie.
Once again, we’ve seen that the Australia is doing great – the economy gained lots of jobs. We’ll now probably see that Australia’s main trade partner, China, is also doing well, and this is likely to provide further strength for the Aussie.
Wednesday, July 7, 2010
EUR/USD Pusing Forward to Touch 1.27..
EUR/USD continued pushing forward and touched 1.27. At this point, it seems that the heights aren’t easy for the pair, that still carries debt issues and gloomy forecasts. Update on this pair.
Euro/Dollar continued the trend that began with the weak Non-Farm Payrolls on Friday and gradually edged up during the week – from the support line of 1.2460, it rose in waves and reached 1.2702, breaking 30 pips above the 1.2672 peak it reached on May 21, in the recovery rally that followed the turmoil.
So, at this point, the highest since the beginning of May, the pair seems exhausted. EUR/USD fell back down to 1.2660 after reaching the new highs. The break seems false and the next line of resistance, 1.2880 is out of reach. 1.2880 was a support line in May 2009.
Below 1.2460, support appears at 1.2330, 1.2250 and most importantly 1.2150. Above, 1.3110 is the next resistance line.
Reasons for Euro rally
The recent Euro rally came on top of weak economic figures in the US, and especially the Non-Farm Payrolls, that disappointed two months in a row. The sentiment is that the US economic recovery is much weaker than expected, meaning low interest rates for a very extended period of time. With a weak US economy, how can the dollar rise?
But there’s something else: the risk factor. The Euro didn’t rally on its own strength, but on US weakness. US weakness is global weakness, and this will eventually trigger risk aversive trading.
The situation in the Euro-zone isn’t good. The European teams might be good football / soccer, but their economies aren’t doing well.
Top economists say that the worst is yet to come:
When fear will return to the markets, the Euro will suffer. The dollar and the yen will rise. So, if you’re enjoying this current risk rally, you better watch out before the tables turn once again.
Euro/Dollar continued the trend that began with the weak Non-Farm Payrolls on Friday and gradually edged up during the week – from the support line of 1.2460, it rose in waves and reached 1.2702, breaking 30 pips above the 1.2672 peak it reached on May 21, in the recovery rally that followed the turmoil.
So, at this point, the highest since the beginning of May, the pair seems exhausted. EUR/USD fell back down to 1.2660 after reaching the new highs. The break seems false and the next line of resistance, 1.2880 is out of reach. 1.2880 was a support line in May 2009.
Below 1.2460, support appears at 1.2330, 1.2250 and most importantly 1.2150. Above, 1.3110 is the next resistance line.
Reasons for Euro rally
The recent Euro rally came on top of weak economic figures in the US, and especially the Non-Farm Payrolls, that disappointed two months in a row. The sentiment is that the US economic recovery is much weaker than expected, meaning low interest rates for a very extended period of time. With a weak US economy, how can the dollar rise?
But there’s something else: the risk factor. The Euro didn’t rally on its own strength, but on US weakness. US weakness is global weakness, and this will eventually trigger risk aversive trading.
The situation in the Euro-zone isn’t good. The European teams might be good football / soccer, but their economies aren’t doing well.
Top economists say that the worst is yet to come:
Shaun Osborne, chief currency strategist at TD Securities Inc. in Toronto, said the euro will depreciate to $1.13 in the third quarter, $1.08 by year-end and may near $1 in 2011 before recovering. Osborne, whose predictions were within 4.1 percent of the mark on average, according to data compiled by Bloomberg, was echoed by the nine following most-accurate forecasters in anticipating a lower euro in the next two quarters.
When fear will return to the markets, the Euro will suffer. The dollar and the yen will rise. So, if you’re enjoying this current risk rally, you better watch out before the tables turn once again.
Subscribe to:
Posts (Atom)