Showing posts with label inflation. Show all posts

Saturday, September 11, 2010

USD/CAD Weekly Technical Forecast (SEP 13-17 2010)

The Canadian dollar had a busy and positive week, and will now have a lighter one – a week in which technicals will have more impact. Here’s an outlook for the Canadian events and an updated technical analysis for USD/CAD, now at lower ground.

USD/CAD daily chart with support and resistance lines marked. Click to enlarge:

Canadian dollar forecast - September 13-17

The third rate hike in Canada wasn’t fully priced, and the release boosted the Canadian dollar. Employment data was also better than predicted and helped push USD/CAD lower. This week, quarterly figures will provide a long term view.

  1. Labor Productivity: Published on Tuesday 12:30. This quarterly release comes rather late. Nevertheless, it’s of high importance and rocks the loonie. In Q1, productivity rose by only 0.7%, half of early expectations. This was good for the Canadian dollar, as low productivity means higher salaries – higher inflation. A similar rise in productivity is expected now – 0.9%.

  2. Capacity Utilization Rate: Published on Tuesday, 12:30. Utilizing more of the available resources means a stronger economy and a chance of a rate hike to cool it down. In Q1, the utilization rate climbed to 74.2%. A similar rate is expected now.

  3. Manufacturing Sales: Published on Wednesday, 12:30. Sales at the gates of manufacturers serve as a good gauge. This stable indicator rose by 0.1% last month, weaker than previous months but exceeding expectations of a drop. Another modest rise is predicted now.


All times are GMT.

USD/CAD Technical Analysis

The Canadian dollar’s week didn’t start of well – An initial drop lower failed and USD/CAD rose to test the 1.05 line (mentioned in last week’s outlook). It then made a sharp drop under 1.04 and tested 1.0280 before closing at 1.0366.

The 1.04 line was the bottom border of a long-term wide range between 1.04 and 1.0750, and now serves as a minor resistance line. Above, 1.05 capped the pair in the past week and also a few weeks ago – it’s now a strong resistance line.

Higher, 1.0680 is a double and stubborn top – it capped USD/CAD at the end of August and also at the beginning of July. Above this line, the pair will meet resistance at 1.0750 which was a resistance line in May last time, and then 1.0850, a swing high in May that also provided resistance back in 2009.

Looking down, 1.0280 supported the pair in July and was also tested in the past week – making it a strong support line. Lower, 1.02 was the 2009 low and also worked as a resistance line after the pair hit parity. It’s now a minor support line.

Lower, the 1.01 line provided support in May and in August and is a strong support line before the ultimate line – parity.

I remain bearish on USD/CAD.

This week’s excellent job figures, among other figures, showed that Canada is on the right track, and will outshine other countries.

Sunday, September 5, 2010

AUD/USD Weekly Technical Forecast (Sep 6-10 2010)

After a great week, another busy one expects Aussie traders. The RBA’s rate decision and employment figures are the highlights. Here’s an outlook for Australian events and an updated technical analysis for AUD/USD.

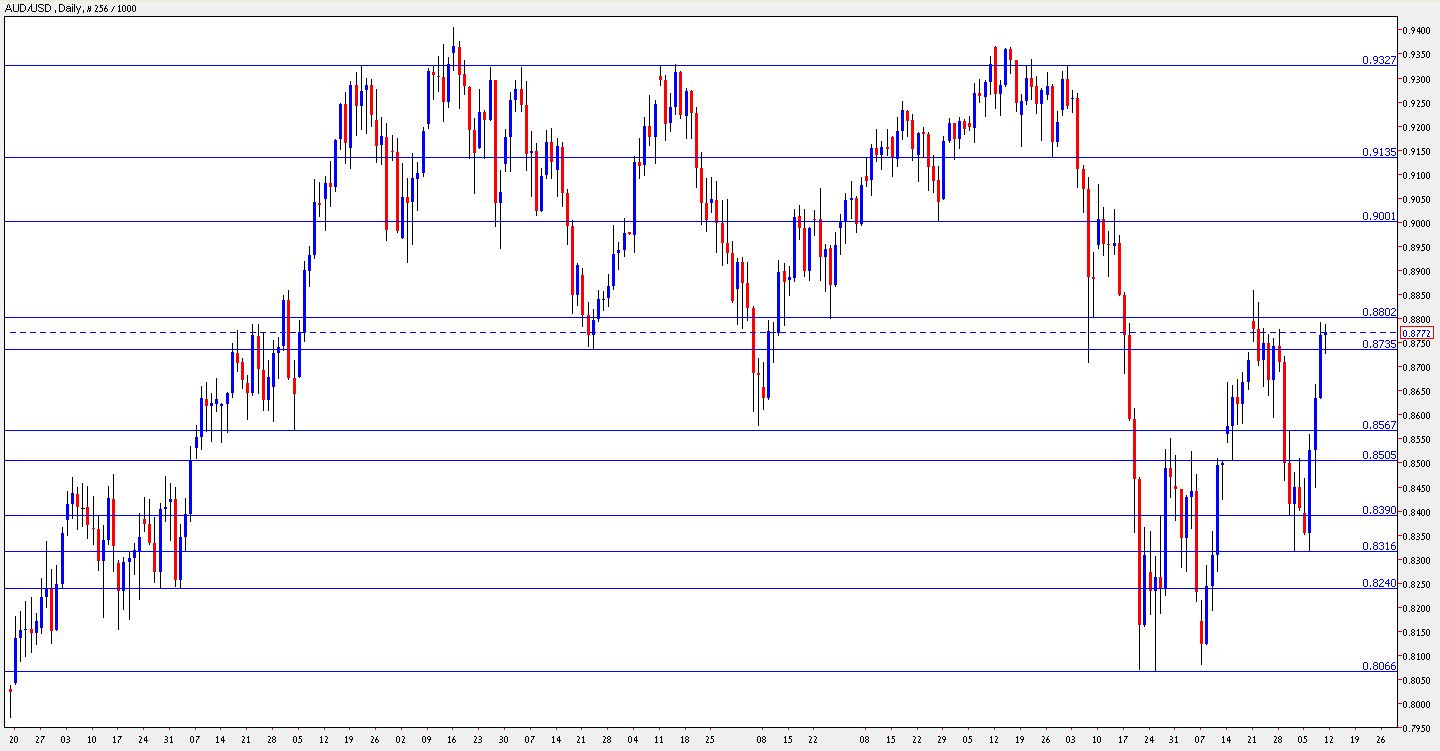
AUD/USD daily graph with support and resistance lines on it. Click to enlarge:

aud usd forecast

The Aussie enjoyed lots of good figures, with the Q2 GDP growth of 1.2% being a great positive surprise. The better-than-expected retail sales figure and especially building approvals, showed that also in Q3, the Australian economy is warming up once again. Will this lead to a renewal of rate hikes?

  1. MI Inflation Gauge: Published on Monday at 12:30 GMT. The Melbourne Institute’s inflation gauge fills in for the government, that publishes an official inflation figure only once per quarter. According to MI, inflation slowed down from 0.5% three months ago, down to 0.1% last month. A similar 0.1% rise is expected this time.

  2. ANZ Job Advertisements: Published on Monday at 1:30 GMT. The amount of jobs published in the media serves as a good indicator for the official employment figures released 3 days later. Last month saw a smaller growth in ads, only 1.3%, and indeed, the gain in jobs was slower than previous months. This time, the rise in ads is expected to slightly stronger.

  3. AIG Construction Index: Published on Monday at 23:30 GMT. The Australia Industry Group showed that the construction sector is slowing down, even contracting in the past two months. The index was under the critical 50 point mark, and this shows an economic squeeze. This goes hand in hand with the slowdown in other housing sector figures – a result of the rate hikes. It’s expected to recover, but remain under 50 points this time.

  4. Rate decision: Published on Tuesday at 4:30 GMT. 4 months have passed since the last rate hike, the sixth since the financial crisis. The hikes took their toll on the economy, and especially on real estate, so Glenn Stevens and his colleagues at the RBA decided to pause on recent months. Also now, the Cash Rate is expected to remain unchanged at 4.50%. The focus will be on the accompanying statement which will hint about future moves.

  5. Home Loans: Published on Wednesday at 1:30 GMT. This important housing sector figure always rocks the Aussie. After a sharp fall of 3.9% last month and many bad months beforehand as well, the number of loans is expected to grow by 1.1% this time, boosting the Aussie.

  6. Employment data: Published on Thursday at 1:30 GMT. After months of excellent figures, last month’s employment numbers were somewhat mixed. Employment Change rose by 23.5K, slightly better than expected, but the unemployment rate jumped to 5.3%, which was a quite a disappointment. A similar gain in jobs, 25.3K is expected now. The unemployment is expected to fall back down to 5.2%. Any result will rock the Aussie.

  7. Guy Debelle talks: Starts speaking on Thursday at 3:00 GMT. RBA deputy governor Dr. Guy Debelle might say more about the fresh rate decision, and add prospects about the future. It’s important to note that in a speech last week, Debelle didn’t mention anything related to monetary policy.

  8. Chinese Trade Balance: Published during Friday. Australia’s main trade partner has a strong impact on the Aussie. This time, the trade balance of the world’s second largest economy will be closely watched. This figure is also sensitive for the value of the Chinese yuan, which is closely monitored by the US. China’s surplus is expected to squeeze from 28.7 to 26.9 billion.


AUD/USD Technical Analysis

The Australian dollar dropped gradually at the beginning of the week, and found support at the 0.8870 line (mentioned in last week’s outlook). It then made a sharp recovery, crossing 0.90 easily, struggling with 0.9080 and finally jumping above 0.9135 to close at 0.9143.

The Aussie is now bound between the 0.9135 line which worked as support back in April, and 0.9220, which was a support line in March and also capped the Aussie at the beginning of August.

Looking down, 0.9080 is the next support line. It was a double top in July and the Aussie leaped above it during a weekend. Lower, the round number of 0.90 provides support. This psychological number was also a swing low in March.

The 0.8870 line was tested in the past week and also capped the pair twice in recent months. It now serves as strong support. 0.8735 was a low point in December 2009 and also in July – minor support now.

Lower, 0.8567 was a support line back in 2009, and also worked as resistance in May. Below, 0.8316 was a double bottom in July and provides strong support. The final line is the year-to-date low 0f 0.8066.

Looking up above 0.9220, the next line is a very strong one – 0.9327. It capped the Aussie many times in the past year. A break above this line will send the pair towards immediate resistance at 0.9366, which was a stubborn line in April.

The 2009 high of 0.9405 is the next resistance line, and it’s followed by 0.95, which was last reached only in 2008.

I remain bullish on the Aussie.

The past week’s strong GDP figures, and a good outcome from the job figures on this busy Australian week, should provide the basis for further gains.

USD/CAD Weekly Technical Forecast (SEP 6-10 2010)

A very busy week expects loonie traders, including a rate decision and employment data. Here’s an outlook for the Canadian events, and an updated technical analysis for USD/CAD.

USD/CAD daily graph with support and resistance lines on it. Click to enlarge:

canadian dollar forecast september 6 10

Canadian GDP for the second quarter, completed with the past week’s release for June, was somewhat disappointing, after two great quarters. The overall situation is still good. This week’s 7 important Canadian releases will shed a lot of light on the current situation. Let’s start:

  1. Building Permits: Published on Wednesday at 12:30 GMT. This is a volatile, yet important gauge for the Canadian economy. Last month’s 6.5% rise in permits boosted the Canadian dollar and corrected the 8.2% fall that was seen in the previous month. The see-saw is predicted to continue with a drop of 5.8%.

  2. Rate decision: Published on Wednesday at 13:00 GMT. There is no clear consensus about this rate decision. After two rate hikes, Mark Carney’s BOC is in a dilemma. On one hand, the economy is doing quite well, and there’s a fear of rising inflation. On the other hand, Canada’s main trader partner, the US, is suffering from a slowdown, that can undermine growth in Canada. So, both an unchanged Overnight Rate of 0.75% and a hike to 1% are equally possible. This means higher than normal volatility around the release. Aslo note the accompanying statement which will indicate future moves. A hike with a statement that there will be a pause from now on can weaken the loonie.

  3. Ivey PMI: Published on Wednesday at 14:00 GMT. The Richard Ivey School of Business disappointed in its last release. The score fell to 54 points, showing that purchasing managers see less expansion. A similar number is expected this time. Only a rise above 50 points, as seen three months ago, will boost the loonie.  A rise to 55.8 is expected.

  4. Housing Starts: Published on Thursday at 12:15 GMT. Complementing on the figure from the previous day, this housing figure wasn’t too good – it fell for the 4th straight month to 189K, the lowest level since February. Another curb is due now, to 185K.

  5. Trade Balance: Published on Thursday at 12:30 GMT. Canada enjoyed a surplus in its trade balance up to April, but the number then turned negative, and even deteriorated to a deficit of 1.1 billion in last month’s release. This deficit will probably squeeze to 0.8 billion. Note that the American trade balance is released at the same time, making the timing very volatile for USD/CAD.

  6. NHPI: Published on Thursday at 12:30 GMT. The last housing figure is an official release of the change in prices of new homes. After 3 months of a 0.3% rise, this stable indicator rose by only 0.1% last month. A stronger rise will probably be seen now. Due to the timing of the publication, together with the trade balance, the impact will probably be quite modest.

  7. Employment data: Published on Friday at 11:00 GMT. The best is kept for last. After three superb months of big gains in jobs, including a surge of 93K jobs one time, last month saw a correction with a loss of 9300 jobs and a rise of the unemployment rate back to the round number of 8%. A gain of 17.6K in jobs is expected now, but the unemployment rate is likely to remain unchanged at 8%.


USD/CAD Technical Analysis

The Canadian dollar had a bad start to the week – USD/CAD failed to break below 1.05 and jumped towards the stubborn 1.0680 line (mentioned also in last week’s outlook). It then made another failed attempt to go under 1.05, but on Friday, this line finally broke and USD/CAD even extended its fall below the 1.04 line.

USD/CAD now trades between support line of 1.0280 and 1.04, which was a long-term bottom border of wide range. It’s now a minor resistance line.

Looking up, the next resistance line is at 1.05, which worked as a strong support line during most of the past week. Higher, the 1.0680 line was successfully tested for a second week in a row, making it a very strong resistance line.

Above, the 1.0750 line was the top border of a long term range, and also a swing high in May. Another swing high in May, the 1.0850 line, works as the next line of resistance, after working as such back in 2009 as well.

Lower, the 2009 low of 1.02 serves as the next line of support. Below, 1.01 capped the pair after it reached parity in April, and also was a low point a few weeks ago.

The ultimate line of support is parity – which got closer in the past week. Beyond parity, 0.98 and 0.97 provide support. They’re far now.

I remain bearish on USD/CAD.

The improvement in US jobs is good for Canada as well, as the US is Canada’s main trade partner. This week is very important for the loonie. A rate hike and positive job figures can send USD/CAD for another attempt on parity.

Saturday, July 10, 2010

AUD/USD Weekly Technical Forecast (July 12-16 2010)


A variety of Australian releases and one Chinese release will move the Aussie in the upcoming week. Here’s an outlook for the Australian events, and an updated technical analysis for AUD/USD, now in higher ground.

AUD/USD daily chart with support and resistance lines. Click to enlarge:

aud usd forecast

The Australian economy enjoys a bubbling job market. The fresh figures came out significantly better than expected, and this gave a big boost to AUD/USD. Will this continue? Let’s start:

  1. Home Loans: Published on Monday at 1:30 GMT. This important housing indicator reflects the impact of the rate hikes – less people are taking loans due to the high interest rate. After 7 consecutive months of drops, the number of loans is finally expected to rise, but at a very modest scale – 0.1%. This will provide a shaky start for AUD/USD at the beginning of the new week.

  2. NAB Business Confidence: Published on Tuesday at 1:30 GMT. National Australia Bank has shown a significant drop in business confidence in the past three months – a drop from 19 to 5 points, although still positive, still showing optimism. This survey of 350 businesses will probably show another drop this time.

  3. Westpac Consumer Sentiment: Published on Wednesday at 1:30 GMT. Westpac’s survey deals with the consumers. 1,200 consumers have shown less confidence in the past three months, with sharp drops of 5.7% and 7% in the past two months. This time, a small rise is expected.

  4. MI Inflation Expectations: Published on Thursday at 1:30 GMT. The Melbourne Institute fills in for the gap created by the government, that publishes the CPI only once per quarter. According to MI, inflation is now weaker – 3.4% in comparison to a strong 4.1% figure three months ago. A drop under 3% will weaken the Aussie.

  5. New Motor Vehicle Sales: Published on Thursday at 1:30 GMT. Vehicle sales are a strong indicator of consumption, but this indicator tends to be very volatile. After a rise of 8.4% two months ago, a drop of 3.2% was seen last month. A small rise is predicted now.

  6. Chinese GDP: Published on Thursday at 2:00 GMT. Australia’s main partner continued to grow rapidly while the West suffered from economic contraction. In the past two quarters, the growth rate return to double digits: 10.5% in Q4 of 2009 and 11.9% in Q1. China releases the figures for Q2 quite early. They’re expected to show a growth rate of 10.5%, still very strong. The Aussie will gain from a stronger rise.


AUD/USD Technical Analysis

The Aussie had a bad start to the week, testing the 0.8315 support line, which it also tested in the previous week. It then began a rally during which it broke many resistance lines and eventually bounced at the resistance line 0f 0.88.

The Aussie is now in a tight range between 0.8735 (December’s low) and the round number of 0.88 which it just tested. Note that some lines have changed since last week’s outlook.

Below 0.8735, the next support line is 0.8567, which served as a strong support line during many months in the past year, and recently worked as a pivotal line. Below, 0.8505 is a minor support line.

Lower, 0.8390 worked as a minor support line in recent months. It’s followed by 0.8315, which was a double bottom in the past two weeks – this makes it a strong line of support now.

Even lower, 0.8240 is an old line of resistance that now serves as a support line, and its followed by the year-to-date low of 0.8066.

Looking up above 0.88, the next line of resistance is the round number of 0.90, which was tested in March and in May. Higher, 0.9327 is a very strong line of resistance which held the Aussie back lots of times in the past year.

Even higher, 0.94 was the 2009 high and its followed by the round number of 0.95, but they’re still far.

I remain bullish on the Aussie.

Once again, we’ve seen that the Australia is doing great – the economy gained lots of jobs. We’ll now probably see that Australia’s main trade partner, China, is also doing well, and this is likely to provide further strength for the Aussie.

AUD/USD Weekly Technical Forecast (July 12-16 2010)


A variety of Australian releases and one Chinese release will move the Aussie in the upcoming week. Here’s an outlook for the Australian events, and an updated technical analysis for AUD/USD, now in higher ground.

AUD/USD daily chart with support and resistance lines. Click to enlarge:

aud usd forecast

The Australian economy enjoys a bubbling job market. The fresh figures came out significantly better than expected, and this gave a big boost to AUD/USD. Will this continue? Let’s start:

  1. Home Loans: Published on Monday at 1:30 GMT. This important housing indicator reflects the impact of the rate hikes – less people are taking loans due to the high interest rate. After 7 consecutive months of drops, the number of loans is finally expected to rise, but at a very modest scale – 0.1%. This will provide a shaky start for AUD/USD at the beginning of the new week.

  2. NAB Business Confidence: Published on Tuesday at 1:30 GMT. National Australia Bank has shown a significant drop in business confidence in the past three months – a drop from 19 to 5 points, although still positive, still showing optimism. This survey of 350 businesses will probably show another drop this time.

  3. Westpac Consumer Sentiment: Published on Wednesday at 1:30 GMT. Westpac’s survey deals with the consumers. 1,200 consumers have shown less confidence in the past three months, with sharp drops of 5.7% and 7% in the past two months. This time, a small rise is expected.

  4. MI Inflation Expectations: Published on Thursday at 1:30 GMT. The Melbourne Institute fills in for the gap created by the government, that publishes the CPI only once per quarter. According to MI, inflation is now weaker – 3.4% in comparison to a strong 4.1% figure three months ago. A drop under 3% will weaken the Aussie.

  5. New Motor Vehicle Sales: Published on Thursday at 1:30 GMT. Vehicle sales are a strong indicator of consumption, but this indicator tends to be very volatile. After a rise of 8.4% two months ago, a drop of 3.2% was seen last month. A small rise is predicted now.

  6. Chinese GDP: Published on Thursday at 2:00 GMT. Australia’s main partner continued to grow rapidly while the West suffered from economic contraction. In the past two quarters, the growth rate return to double digits: 10.5% in Q4 of 2009 and 11.9% in Q1. China releases the figures for Q2 quite early. They’re expected to show a growth rate of 10.5%, still very strong. The Aussie will gain from a stronger rise.


AUD/USD Technical Analysis

The Aussie had a bad start to the week, testing the 0.8315 support line, which it also tested in the previous week. It then began a rally during which it broke many resistance lines and eventually bounced at the resistance line 0f 0.88.

The Aussie is now in a tight range between 0.8735 (December’s low) and the round number of 0.88 which it just tested. Note that some lines have changed since last week’s outlook.

Below 0.8735, the next support line is 0.8567, which served as a strong support line during many months in the past year, and recently worked as a pivotal line. Below, 0.8505 is a minor support line.

Lower, 0.8390 worked as a minor support line in recent months. It’s followed by 0.8315, which was a double bottom in the past two weeks – this makes it a strong line of support now.

Even lower, 0.8240 is an old line of resistance that now serves as a support line, and its followed by the year-to-date low of 0.8066.

Looking up above 0.88, the next line of resistance is the round number of 0.90, which was tested in March and in May. Higher, 0.9327 is a very strong line of resistance which held the Aussie back lots of times in the past year.

Even higher, 0.94 was the 2009 high and its followed by the round number of 0.95, but they’re still far.

I remain bullish on the Aussie.

Once again, we’ve seen that the Australia is doing great – the economy gained lots of jobs. We’ll now probably see that Australia’s main trade partner, China, is also doing well, and this is likely to provide further strength for the Aussie.

NZD/USD Weekly Technical Forecast (July 12-16 2010)


Retail sales and the all-important CPI are the major events that will rock the kiwi this week. Here’s an outlook for the events in New Zealand, and an updated technical analysis for NZD/USD.

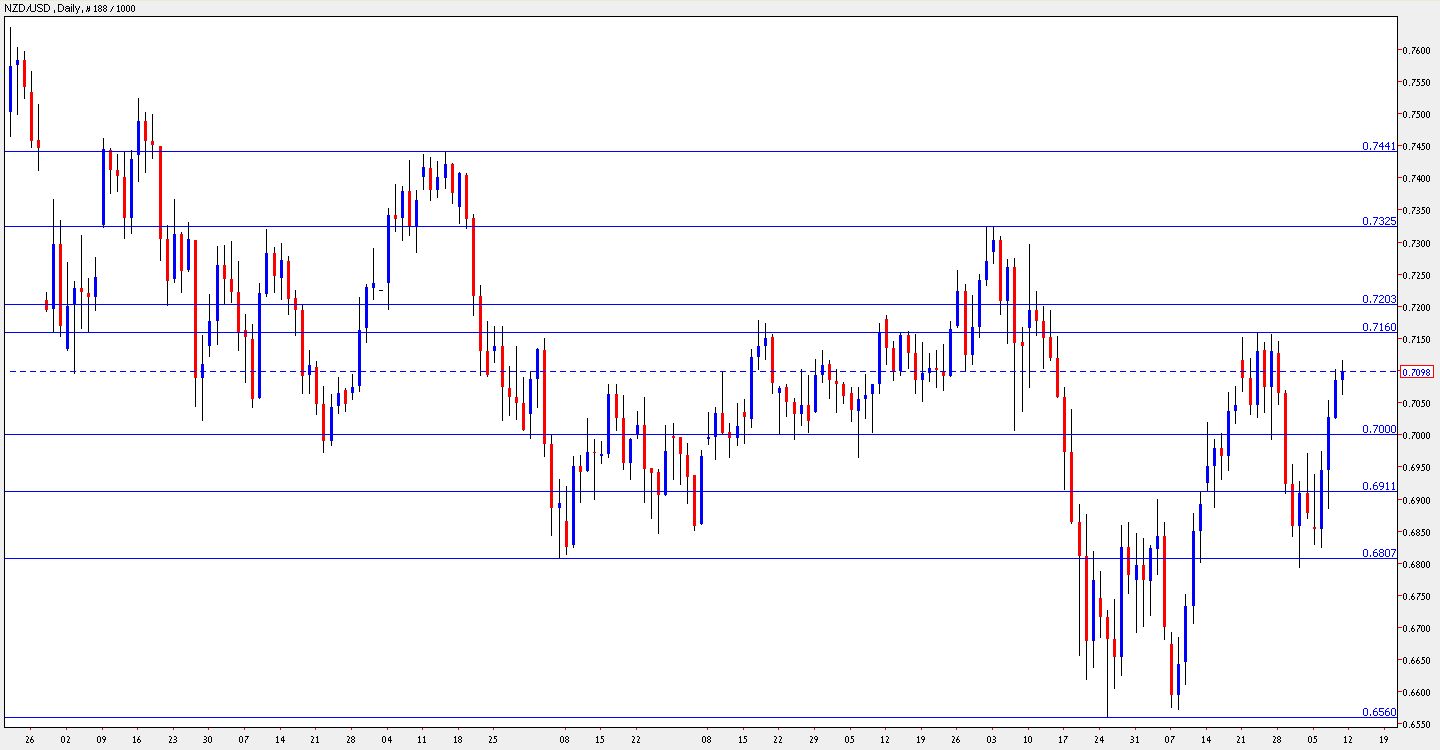
NZD/USD daily chart with support and resistance lines. Click to enlarge:

nzd usd forecast

The kiwi advanced after crossing the round number of 0.70. It’s further steps depend now on inflation, which will determine the outcome of the next rate decision. Let’s start:

  1. FPI: Published on Monday at 22:45 GMT. This monthly gap fills the gap that the government creates by releasing inflation figures only once per quarter. The prices of food, which fell in the past two months, is expected to rise this time. This will be an indicator for the CPI released later in the week.

  2. Retail Sales: Published on Tuesday at 22:45 GMT. Consumers disappointed in the past three months. Sales grew less than expected, or fell more than expected. This important indicator hurt the kiwi. After a drop of 0.6% last month, a rise of 0.6% is predicted now. Also note core retail sales, which fell by 0.2% and are likely to rise by 0.6% now. We’ve seen a strong impact when retail sales fell two months ago.

  3. Business NZ Manufacturing Index: Published on Wednesday at 22:30 GMT. This survey of manufacturers fell from the peak it reached two months ago and dropped from 58.6 to 54.5 points. Another drop is expected now, but the number will probably remain above 50, meaning economic expansion.

  4. CPI: Published on Thursday at 22:45 GMT. A rise in the consumer price index is the key to an intense tightening cycle by the central bank, that already began. Last quarter’s rise of 0.4% will probably be followed by a rise of 0.5% this time. A jump above 1% will boost the kiwi.


NZD/USD Technical Analysis

The kiwi continued struggling with the 0.6910 line at the beginning of the week, but then made a strong move upwards and broke above the round number of 0.70 to close just under 0.71.

NZD/USD’s range is between the round support line of 0.70 and the next resistance line of 0.7160, which was a stubborn top during June. The next line of resistance is at 0.72, which capped the kiwi in the past.

Higher, May’s highs of 0.7325 provide the next strong resistance line. This was an area of resistance also in December. The last line of resistance is at 0.7440, which was a peak at the beginning of the year.

Looking down below 0.70, 0.6910 provides the next support line. It has been a pivotal line recently. Lower, 0.68 provides support very recently and also in February, and is the next line of support.

There are many lines below, but the most notable one is 0.6560, which was the year-to-date low.

I remain bullish on the kiwi.

With a stable, growing economy, and with a cycle of rate hikes that already began, it’s likely to gradually rise.

NZD/USD Weekly Technical Forecast (July 12-16 2010)


Retail sales and the all-important CPI are the major events that will rock the kiwi this week. Here’s an outlook for the events in New Zealand, and an updated technical analysis for NZD/USD.

NZD/USD daily chart with support and resistance lines. Click to enlarge:

nzd usd forecast

The kiwi advanced after crossing the round number of 0.70. It’s further steps depend now on inflation, which will determine the outcome of the next rate decision. Let’s start:

  1. FPI: Published on Monday at 22:45 GMT. This monthly gap fills the gap that the government creates by releasing inflation figures only once per quarter. The prices of food, which fell in the past two months, is expected to rise this time. This will be an indicator for the CPI released later in the week.

  2. Retail Sales: Published on Tuesday at 22:45 GMT. Consumers disappointed in the past three months. Sales grew less than expected, or fell more than expected. This important indicator hurt the kiwi. After a drop of 0.6% last month, a rise of 0.6% is predicted now. Also note core retail sales, which fell by 0.2% and are likely to rise by 0.6% now. We’ve seen a strong impact when retail sales fell two months ago.

  3. Business NZ Manufacturing Index: Published on Wednesday at 22:30 GMT. This survey of manufacturers fell from the peak it reached two months ago and dropped from 58.6 to 54.5 points. Another drop is expected now, but the number will probably remain above 50, meaning economic expansion.

  4. CPI: Published on Thursday at 22:45 GMT. A rise in the consumer price index is the key to an intense tightening cycle by the central bank, that already began. Last quarter’s rise of 0.4% will probably be followed by a rise of 0.5% this time. A jump above 1% will boost the kiwi.


NZD/USD Technical Analysis

The kiwi continued struggling with the 0.6910 line at the beginning of the week, but then made a strong move upwards and broke above the round number of 0.70 to close just under 0.71.

NZD/USD’s range is between the round support line of 0.70 and the next resistance line of 0.7160, which was a stubborn top during June. The next line of resistance is at 0.72, which capped the kiwi in the past.

Higher, May’s highs of 0.7325 provide the next strong resistance line. This was an area of resistance also in December. The last line of resistance is at 0.7440, which was a peak at the beginning of the year.

Looking down below 0.70, 0.6910 provides the next support line. It has been a pivotal line recently. Lower, 0.68 provides support very recently and also in February, and is the next line of support.

There are many lines below, but the most notable one is 0.6560, which was the year-to-date low.

I remain bullish on the kiwi.

With a stable, growing economy, and with a cycle of rate hikes that already began, it’s likely to gradually rise.

Friday, July 9, 2010

GBP/USD Is Range Bound– Will it Fall?

GBP/USD is trading in an almost perfect range in the past week. The longer the range – the stronger the explosion, but in which direction? Here are some reasons for it to go down.

Last Friday, GBP/USD enjoyed the weak Non-Farm Payrolls in the US to rise to new levels. Since then, it has traded in an almost perfect range – from 1.5080 to 1.5240. This 160 pip range saw three tops and three bottom throughout the week, without breaking out. But the situation doesn’t look good for the Pound:

Recent economic data is mostly negative. British Services PMI disappointed with a drop to 54.4 points, worse than expected. Halifax HPI, which shows the change in house prices, fell by 0.6% instead of rising by the same scale. Manufacturing Production fell short of expectations as it rose by only 0.3%, and last month’s drop was revised – 0.8% instead of 0.8% – double.

But the biggest disappointment came from interest rate issues. First, the Bank of England didn’t raise the rates. While this was the consensus, this came after we saw that one member voted to raise the rates last month – Andrew Sentance’s vote came on rising inflation that missed the government’s target month by month.

The decision not to raise the rates was later backed with the PPI figures – producer prices dropped last month by 0.2% when expectations stood on a rise of 0.1%. So, maybe the inflationary pressures aren’t too strong?

Similar to the Euro, it seems that the British Pound mostly enjoyed the US dollar’s weakness rather than its own strength. A drop will find immediate support at 1.5050, followed by 1.4870 and 1.4780. A breakout to the upside will meet resistance at 1.5350, followed by 1.5530 and 1.5833.

Sunday, June 27, 2010

EUR/USD Weekly Technical Forecast (June 28-July 2 2010)


The troubled Euro expects inflation and employment figures in the upcoming week. Here’s an outlook for the events that will move the Euro, and an updated technical analysis for EUR/USD.

EUR/USD daily chart with support and resistance lines on it. Click to enlarge:

euro dollar forecast

In the past week, the Euro got a positive indicator from the German Ifo Business Climate, but the impact was very limited. This week has more significant indicators. Let’s begin:

  1. German CPI: Published on Monday. After showing some signs of picking up, inflation returned to normal in the past two months, rising by 0.1% last month, after a drop in the same small scale beforehand. The initial version of the CPI is collected from the various German states throughout the day. A small rise is expected this time.

  2. M3 Money Supply: Published on Monday at 8:00 GMT. The amount of money in circulation usually rises, but the drop seen in the past 3 months is another evidence of less economic activity and an upcoming double-dip recession. Another drop of 0.1% is expected this time.

  3. German Unemployment Change: Published on Wednesday at 7:55 GMT. This important figure shows that Germany continues to be the locomotive of the Euro-zone. The number of unemployed people squeezed by 45,000 people, for a third month in a row. Another small drop is expected now. Note that the actual figure was usually better than early forecasts.

  4. CPI Flash Estimate: Published on Wednesday at 9:00 GMT. Following Germany’s first release for the inflation figures, the figure for the whole continent is also published. The annualized level of inflation rose to 1.6% last month – still under control. Only a jump above 2% could be significant for the Euro, and this isn’t expected now.

  5. Unemployment Rate: Published on Friday at 9:00 GMT. The all-European unemployment rate is very problematic – 10.1%. The area of 10% has been with us for the past 7 months and this isn’t about to change. Any rise will be a burden on the Euro, and only a fall to a single digit figure will boost the common currency.


EUR/USD Technical Analysis


The Euro began the week by descending from a failed attempt to break above 1.2460, and eventually dropped below 1.2330. A false break under 1.2250 was followed by a jump, and the pair closed at 1.2375.

The Euro’s range is 1.2330 to 1.2460. Note that more lines were added on last week’s outlook. The trading ranges of the pair are more narrow now.

Above the strong line of 1.2460, a minor resistance line appears at 1.2520, which was a swing low when the pair was dropping from higher levels. Higher, 1.2670 provides strong resistance, being the highest level in over a month.

Higher, 1.2880 is the next minor line, followed by 1.3114, which was tested from both directions, but that’s quite far now.

Looking down, the Lehman levels at 1.2330 continue to play a small role. The next level of support is at 1.2250, which the pair failed to break in the past week. 1.2150 is a very strong line – it held the pair for some time, and when it collapsed, the fall was quite strong.

1.20 is a round number eyed by many, so it provides further support, and the last line is 1.1876, the year-to-date low.

I remain neutral on Euro/Dollar.

As mentioned last week, range trading indeed continued for another week. Given the looming double dip recession, the European debt issues and risk aversive trading due to slowdown in the US as well, the long term sees further drops. But for now, the narrowing ranges are still with us.

AUD/USD Weekly Technical Forecast (June 28-July 2 2010)


Retail Sales as well as building approvals are the highlights in a busy Australian week. Will the Aussie continue north? Here’s an outlook for the Australian events and an updated technical analysis for AUD/USD.

AUD/USD daily chart with support and resistance lines on it. Click to enlarge:

australian-dollar-aud-usd-forecast

The Chinese move on the yuan is great for Australia, that exports commodities to China. With a stronger yuan, the Chinese can buy more. As the dust settled from  this move, the political problems in Australia hurt the Aussie. With the new Prime Minister sworn in, the focus returns to fundamentals:

  1. HIA New Home Sales: Publication time unknown at the moment. The Housing Industry Association showed a bit leap in prices last month – 6.2%. This comes despite the rate hikes that partially cooled the Australian housing sector. A smaller rise is expected this time.

  2. MI Inflation Gauge: Published on Tuesday at 00:30 GMT. The official inflation figures are released only once a quarter. So, this unofficial release from the Melbourne Institute tends to moves the Aussie. After rises of 0.4% or 0.5% in recent months, a weaker rise in prices is predicted this time.

  3. Private Sector Credit: Published on Wednesday at 1:30 GMT. More lending means more economic activity, but last month’s small rise of 0.2% was quite disappointing for the Aussie. This followed 4 stronger months. A return to higher growth rates will probably be reported by the RBA this time.

  4. AIG Manufacturing Index: Published on Wednesday at 23:30 GMT. The Australia Industry Group publishes a PMI-like indicator that has been above 50 in the past 5 months. This means expectations for economic expansion. The drop from the high 59.8 points to 56.3 last month is expected to be followed by a stable number this time.

  5. Chinese Manufacturing PMI: Published on Thursday at 1:00 GMT. China is Australia’s main trade partner. Growth in Chinese manufacturing translates into more imports from Australia. After peaking at 55.7 points, this Chinese indicator fell to 53.9 points this time. A rise is expected this time.

  6. Retail Sales: Published on Thursday at 1:30 GMT. This major consumer-related indicator rose by 0.6% last month, showing confidence for a second month in a row, despite the rate hikes. A smaller rise is expected this time.

  7. Commodity Prices: Published on Thursday at 6:30 GMT. Australia’s commodity-oriented economy enjoyed a recovery in commodity prices in June. This will be reflected in this  indicator that is expected to show a year-over-year growth rate of over 50%, boosting the Aussie.

  8. Building Approvals: Published on Friday at 1:30 GMT. This indicator is very volatile, and tends to have a strong impact on the Aussie. A drop of almost 15% was reported in approvals last month, but this was merely a correction for a 17% rise beforehand. A rise in approvals will empower the Aussie.


AUD/USD Technical Analysis


The Aussie’s crazy week began with a temporary jump above 0.8735 and then 0.88, but this changed quickly. The pair deteriorated quickly and dipped below 0.86 before recovering and settling slightly higher than last week – at 0.8741. Note that most lines haven’t changed since last week’s outlook.

Looking up, 0.88 continues to be a minor line of resistance, and the break above it was false. Higher, 0.90 is a round psychological number and also was a swing low in March.

Higher, 0.9135 was a very strong line of support when the pair was trading higher, and now works as resistance. The next important line far above is 0.9327, which was a strong line of resistance many times in the past.

Looking down, immediate support is found at 0.8735, which was December’s low, and worked as a line of resistance in the previous week. Lower, 0.8360 was a pivotal line a few weeks ago.

Lower, 0.8240 was a strong resistance line in 2009 and worked when the pair was trading lower recently. Below, the year-to-date low of 0.8066 provides strong support. That’s quite far now.

I remain bullish on the Aussie.

The political crisis that rocked the Aussie is over, with a new Prime Minister, Julia Gillard, quickly assuming office. With the revaluation of the Chinese yuan, a high interest rate and strong economy, the Australian dollar continues to have good reasons to rise.

Sunday, June 20, 2010

USD/CAD Weekly Technical Forecast (June 21-25 2010)


The loonie enjoyed risk appetite for a second week in a row. This week consists of key indicators for the next rate decision. Here’s an outlook for Canadian events and an updated technical analysis for USD/CAD, which is closer to parity once again.

USD/CAD chart with resistance and support lines on it. Click to enlarge:

canadian dollar forecast

The markets disregard the European trouble (with focus now on Spain again) and seek “risky” currencies. The Canadian dollar also enjoys the rising price of oil, and his its eyes on parity. Prices need to rise in other areas in order to push inflation. Let’s start:

  1. CPI: Published on Tuesday at 11:00 GMT. A rise in the consumer price index is necessary for further rate hikes, after the BOC made its first move. Current inflation conditions are still tame. CPI rose by 0.3% last month after remaining unchanged beforehand, and Core CPI, which is also closely watched by the central bank, also rose by 0.3%. More modest rises are expected this time.

  2. Retail Sales: Published on Wednesday at 12:30 GMT. This major consumer indicator made a surprising jump last month – 2.1% instead of 0.2% that was predicted. Also the core figure was a big surprise, jumping by 1.7%. Yet again, the expectations remain modest, with a rises of less than 1% predicted in both indicators.


USD/CAD Technical Analysis


The Canadian dollar continued the trend from last week, and after falling below 1.04, USD/CAD continued to fall gradually towards the next support line – 1.02, which it closed very close to, at 1.0210.

1.02 continues to be a dominant line – this was the 2009 low and also a line of resistance when the pair reached parity. A break below 1.02 will send the pair towards minor support at 1.01 (a line that was added on last week’s outlook).

Below 1.01 comes the ultimate support line – parity. USD/CAD parity was last seen in April but didn’t hold for too long. Lower, 0.98 is a minor line of support, followed by 0.97. A bigger surge in oil prices is necessary for the pair to approach these areas.

Looking up, the immediate resistance line is at 1.0560, which served as a line of support and resistance in recent weeks. Higher, 1.0750 was the high line of long time range, and was also tested about a month ago. It’s followed by 1.0850, which was a swing high before the pair went lower.

I remain bearish on USD/CAD.

As the fear factor leaves the markets, the Canadian dollar, with a growing economy, receives the strength it deserves. Next stop – parity.

Famous Posts

Saturday, June 12, 2010

FOREX Fundamental Analysis Defination with Description.

Most FOREX traders rely on analysis to make plan their trading strategy. This article will discuss fundamental analysis. The other common form of analysis is technical analysis. After reading this article you should have a better understanding of fundamental analysis and how to use it as part of your FOREX strategy.

Political and economic changes are the basis of fundamental analysis. These can frequently affect currency prices. Traders that take advantage of fundamental analysis will gather their information from a variety of news sources. They are looking for information about unemployment forecasts, political ideologies, economic policies, inflation and growth rates.

Fundamental analysis will provide you with an overview of currency movements and a broad picture of the economic conditions. Most traders then will combine their fundamental analysis with technical analysis to plot actual entrance and exit points as well as confirming the information provided by their fundamental analysis.

Just like most markets the FOREX market is controlled by supply and demand. Many economic factors can affect the supply and demand but the two most critical ones are interest rates and the strength of the economy. The over all strength of the economy is affected by changes in the GDP, trade balances and the amount of foreign investment.

There are many economic indicators released by government and academic sources. These indicators are usually released on a monthly basis but will sometimes be released weekly. These are pretty reliable measures of economic health and are closely followed by all traders.

There are many indicators that are released but some of the most important and commonly followed are : interest rates, international trade, CPI, durable goods orders, PPI, PMI and retail orders.

Interest Rates - can cause a currency to either strengthen or weaken depending on the direction of movement. In some cases high interest rates will attract foreign money, however high interest rates will frequently cause stock market investors to sell of their portfolios. They do this believing that the higher cost of borrowing money will adversely affect many companies. If enough investors sell of their holdings in can cause a downturn in the market and negatively affect the economy.

Which of these two affects will take place depends on many complex factors, but there is usually an agreement among economic observers as to how the current change in interest rates will affect the general economy and the price of the currency.

International Trade - If there is a trade deficit (more items imported than exported) it is usually considered a negative indicator. When there is a trade deficit it means that more money is leaving the country to buy foreign goods than is entering the country and this can have a devaluing effect on the currency. Usually though trade imbalances are already factored into the market consideration. If a country normally operates with a trade deficit then there should not be an affect on the currency price. The currency price will normally only be effected by trade differences when the deficit is greater than the market expected.

The measurement of the cost of living (CPI) and the cost of producing goods (PPI) are a couple of other important indicators. You should also watch the GDP which measures the value of all the goods produced in a country and the M2 Money Supply which measures the total amount of currency for a country.

In the US alone there are 28 major indicators, these can have a strong effect on the financial market and should be closely watched. This information can be found many places on the internet and is provided by many brokers.

Related Blogs