
Showing posts with label gain. Show all posts
Showing posts with label gain. Show all posts
Saturday, September 11, 2010


Sunday, September 5, 2010
AUD/USD Weekly Technical Forecast (Sep 6-10 2010)
After a great week, another busy one expects Aussie traders. The RBA’s rate decision and employment figures are the highlights. Here’s an outlook for Australian events and an updated technical analysis for AUD/USD.
AUD/USD daily graph with support and resistance lines on it. Click to enlarge:

The Aussie enjoyed lots of good figures, with the Q2 GDP growth of 1.2% being a great positive surprise. The better-than-expected retail sales figure and especially building approvals, showed that also in Q3, the Australian economy is warming up once again. Will this lead to a renewal of rate hikes?
AUD/USD Technical Analysis
The Australian dollar dropped gradually at the beginning of the week, and found support at the 0.8870 line (mentioned in last week’s outlook). It then made a sharp recovery, crossing 0.90 easily, struggling with 0.9080 and finally jumping above 0.9135 to close at 0.9143.
The Aussie is now bound between the 0.9135 line which worked as support back in April, and 0.9220, which was a support line in March and also capped the Aussie at the beginning of August.
Looking down, 0.9080 is the next support line. It was a double top in July and the Aussie leaped above it during a weekend. Lower, the round number of 0.90 provides support. This psychological number was also a swing low in March.
The 0.8870 line was tested in the past week and also capped the pair twice in recent months. It now serves as strong support. 0.8735 was a low point in December 2009 and also in July – minor support now.
Lower, 0.8567 was a support line back in 2009, and also worked as resistance in May. Below, 0.8316 was a double bottom in July and provides strong support. The final line is the year-to-date low 0f 0.8066.
Looking up above 0.9220, the next line is a very strong one – 0.9327. It capped the Aussie many times in the past year. A break above this line will send the pair towards immediate resistance at 0.9366, which was a stubborn line in April.
The 2009 high of 0.9405 is the next resistance line, and it’s followed by 0.95, which was last reached only in 2008.
I remain bullish on the Aussie.
The past week’s strong GDP figures, and a good outcome from the job figures on this busy Australian week, should provide the basis for further gains.
AUD/USD daily graph with support and resistance lines on it. Click to enlarge:

The Aussie enjoyed lots of good figures, with the Q2 GDP growth of 1.2% being a great positive surprise. The better-than-expected retail sales figure and especially building approvals, showed that also in Q3, the Australian economy is warming up once again. Will this lead to a renewal of rate hikes?
- MI Inflation Gauge: Published on Monday at 12:30 GMT. The Melbourne Institute’s inflation gauge fills in for the government, that publishes an official inflation figure only once per quarter. According to MI, inflation slowed down from 0.5% three months ago, down to 0.1% last month. A similar 0.1% rise is expected this time.
- ANZ Job Advertisements: Published on Monday at 1:30 GMT. The amount of jobs published in the media serves as a good indicator for the official employment figures released 3 days later. Last month saw a smaller growth in ads, only 1.3%, and indeed, the gain in jobs was slower than previous months. This time, the rise in ads is expected to slightly stronger.
- AIG Construction Index: Published on Monday at 23:30 GMT. The Australia Industry Group showed that the construction sector is slowing down, even contracting in the past two months. The index was under the critical 50 point mark, and this shows an economic squeeze. This goes hand in hand with the slowdown in other housing sector figures – a result of the rate hikes. It’s expected to recover, but remain under 50 points this time.
- Rate decision: Published on Tuesday at 4:30 GMT. 4 months have passed since the last rate hike, the sixth since the financial crisis. The hikes took their toll on the economy, and especially on real estate, so Glenn Stevens and his colleagues at the RBA decided to pause on recent months. Also now, the Cash Rate is expected to remain unchanged at 4.50%. The focus will be on the accompanying statement which will hint about future moves.
- Home Loans: Published on Wednesday at 1:30 GMT. This important housing sector figure always rocks the Aussie. After a sharp fall of 3.9% last month and many bad months beforehand as well, the number of loans is expected to grow by 1.1% this time, boosting the Aussie.
- Employment data: Published on Thursday at 1:30 GMT. After months of excellent figures, last month’s employment numbers were somewhat mixed. Employment Change rose by 23.5K, slightly better than expected, but the unemployment rate jumped to 5.3%, which was a quite a disappointment. A similar gain in jobs, 25.3K is expected now. The unemployment is expected to fall back down to 5.2%. Any result will rock the Aussie.
- Guy Debelle talks: Starts speaking on Thursday at 3:00 GMT. RBA deputy governor Dr. Guy Debelle might say more about the fresh rate decision, and add prospects about the future. It’s important to note that in a speech last week, Debelle didn’t mention anything related to monetary policy.
- Chinese Trade Balance: Published during Friday. Australia’s main trade partner has a strong impact on the Aussie. This time, the trade balance of the world’s second largest economy will be closely watched. This figure is also sensitive for the value of the Chinese yuan, which is closely monitored by the US. China’s surplus is expected to squeeze from 28.7 to 26.9 billion.
AUD/USD Technical Analysis
The Australian dollar dropped gradually at the beginning of the week, and found support at the 0.8870 line (mentioned in last week’s outlook). It then made a sharp recovery, crossing 0.90 easily, struggling with 0.9080 and finally jumping above 0.9135 to close at 0.9143.
The Aussie is now bound between the 0.9135 line which worked as support back in April, and 0.9220, which was a support line in March and also capped the Aussie at the beginning of August.
Looking down, 0.9080 is the next support line. It was a double top in July and the Aussie leaped above it during a weekend. Lower, the round number of 0.90 provides support. This psychological number was also a swing low in March.
The 0.8870 line was tested in the past week and also capped the pair twice in recent months. It now serves as strong support. 0.8735 was a low point in December 2009 and also in July – minor support now.
Lower, 0.8567 was a support line back in 2009, and also worked as resistance in May. Below, 0.8316 was a double bottom in July and provides strong support. The final line is the year-to-date low 0f 0.8066.
Looking up above 0.9220, the next line is a very strong one – 0.9327. It capped the Aussie many times in the past year. A break above this line will send the pair towards immediate resistance at 0.9366, which was a stubborn line in April.
The 2009 high of 0.9405 is the next resistance line, and it’s followed by 0.95, which was last reached only in 2008.
I remain bullish on the Aussie.
The past week’s strong GDP figures, and a good outcome from the job figures on this busy Australian week, should provide the basis for further gains.
USD/CAD Weekly Technical Forecast (SEP 6-10 2010)
A very busy week expects loonie traders, including a rate decision and employment data. Here’s an outlook for the Canadian events, and an updated technical analysis for USD/CAD.
USD/CAD daily graph with support and resistance lines on it. Click to enlarge:

Canadian GDP for the second quarter, completed with the past week’s release for June, was somewhat disappointing, after two great quarters. The overall situation is still good. This week’s 7 important Canadian releases will shed a lot of light on the current situation. Let’s start:
USD/CAD Technical Analysis
The Canadian dollar had a bad start to the week – USD/CAD failed to break below 1.05 and jumped towards the stubborn 1.0680 line (mentioned also in last week’s outlook). It then made another failed attempt to go under 1.05, but on Friday, this line finally broke and USD/CAD even extended its fall below the 1.04 line.
USD/CAD now trades between support line of 1.0280 and 1.04, which was a long-term bottom border of wide range. It’s now a minor resistance line.
Looking up, the next resistance line is at 1.05, which worked as a strong support line during most of the past week. Higher, the 1.0680 line was successfully tested for a second week in a row, making it a very strong resistance line.
Above, the 1.0750 line was the top border of a long term range, and also a swing high in May. Another swing high in May, the 1.0850 line, works as the next line of resistance, after working as such back in 2009 as well.
Lower, the 2009 low of 1.02 serves as the next line of support. Below, 1.01 capped the pair after it reached parity in April, and also was a low point a few weeks ago.
The ultimate line of support is parity – which got closer in the past week. Beyond parity, 0.98 and 0.97 provide support. They’re far now.
I remain bearish on USD/CAD.
The improvement in US jobs is good for Canada as well, as the US is Canada’s main trade partner. This week is very important for the loonie. A rate hike and positive job figures can send USD/CAD for another attempt on parity.
USD/CAD daily graph with support and resistance lines on it. Click to enlarge:

Canadian GDP for the second quarter, completed with the past week’s release for June, was somewhat disappointing, after two great quarters. The overall situation is still good. This week’s 7 important Canadian releases will shed a lot of light on the current situation. Let’s start:
- Building Permits: Published on Wednesday at 12:30 GMT. This is a volatile, yet important gauge for the Canadian economy. Last month’s 6.5% rise in permits boosted the Canadian dollar and corrected the 8.2% fall that was seen in the previous month. The see-saw is predicted to continue with a drop of 5.8%.
- Rate decision: Published on Wednesday at 13:00 GMT. There is no clear consensus about this rate decision. After two rate hikes, Mark Carney’s BOC is in a dilemma. On one hand, the economy is doing quite well, and there’s a fear of rising inflation. On the other hand, Canada’s main trader partner, the US, is suffering from a slowdown, that can undermine growth in Canada. So, both an unchanged Overnight Rate of 0.75% and a hike to 1% are equally possible. This means higher than normal volatility around the release. Aslo note the accompanying statement which will indicate future moves. A hike with a statement that there will be a pause from now on can weaken the loonie.
- Ivey PMI: Published on Wednesday at 14:00 GMT. The Richard Ivey School of Business disappointed in its last release. The score fell to 54 points, showing that purchasing managers see less expansion. A similar number is expected this time. Only a rise above 50 points, as seen three months ago, will boost the loonie. A rise to 55.8 is expected.
- Housing Starts: Published on Thursday at 12:15 GMT. Complementing on the figure from the previous day, this housing figure wasn’t too good – it fell for the 4th straight month to 189K, the lowest level since February. Another curb is due now, to 185K.
- Trade Balance: Published on Thursday at 12:30 GMT. Canada enjoyed a surplus in its trade balance up to April, but the number then turned negative, and even deteriorated to a deficit of 1.1 billion in last month’s release. This deficit will probably squeeze to 0.8 billion. Note that the American trade balance is released at the same time, making the timing very volatile for USD/CAD.
- NHPI: Published on Thursday at 12:30 GMT. The last housing figure is an official release of the change in prices of new homes. After 3 months of a 0.3% rise, this stable indicator rose by only 0.1% last month. A stronger rise will probably be seen now. Due to the timing of the publication, together with the trade balance, the impact will probably be quite modest.
- Employment data: Published on Friday at 11:00 GMT. The best is kept for last. After three superb months of big gains in jobs, including a surge of 93K jobs one time, last month saw a correction with a loss of 9300 jobs and a rise of the unemployment rate back to the round number of 8%. A gain of 17.6K in jobs is expected now, but the unemployment rate is likely to remain unchanged at 8%.
USD/CAD Technical Analysis
The Canadian dollar had a bad start to the week – USD/CAD failed to break below 1.05 and jumped towards the stubborn 1.0680 line (mentioned also in last week’s outlook). It then made another failed attempt to go under 1.05, but on Friday, this line finally broke and USD/CAD even extended its fall below the 1.04 line.
USD/CAD now trades between support line of 1.0280 and 1.04, which was a long-term bottom border of wide range. It’s now a minor resistance line.
Looking up, the next resistance line is at 1.05, which worked as a strong support line during most of the past week. Higher, the 1.0680 line was successfully tested for a second week in a row, making it a very strong resistance line.
Above, the 1.0750 line was the top border of a long term range, and also a swing high in May. Another swing high in May, the 1.0850 line, works as the next line of resistance, after working as such back in 2009 as well.
Lower, the 2009 low of 1.02 serves as the next line of support. Below, 1.01 capped the pair after it reached parity in April, and also was a low point a few weeks ago.
The ultimate line of support is parity – which got closer in the past week. Beyond parity, 0.98 and 0.97 provide support. They’re far now.
I remain bearish on USD/CAD.
The improvement in US jobs is good for Canada as well, as the US is Canada’s main trade partner. This week is very important for the loonie. A rate hike and positive job figures can send USD/CAD for another attempt on parity.
Sunday, July 11, 2010
EUR/USD Is Ending Its Bullish Correction?
Euro/Dollar had another positive week, but it failed to break above the important long term resistance line. Also the short term trends show an exhaustion. Will it turn down?
EUR/USD began a strong upwards move on last week’s Non-Farm Payrolls but couldn’t break the resistance line. These moves came on top of US weakness and not on an improvement in Europe. Yohay already wrote about these issues earlier this week on forexcrunch . Now let’s look at another technical aspect.

Looking at the hourly chart, we can see a rising uptrend channel that accompanied the Euro in the past week. This can be seen in the graph. The top of this uptrend channel was challenged more than 3 times, and is very clear. As the Euro climbed upwards, it closely followed this top border.
The bottom border of this line was approached three times. While the pair stayed away from this line during most of the week, it closed at 1.2639, quite close to it. Together with the failure to making a convincing break above 1.2672 (which was the peak on May 21st) and settling at the bottom of the uptrend channel, this shows again that EUR/USD is out of air.
Apart for the regular events that are expecting us (detailed in the Euro dollar forecasts), there’s a very important one-time event on July 23rd – results of the bank stress tests. This will determine how the European banks are dealing with the debt crisis, the big issue looming over the Euro-zone in the past few months.
EUR/USD began a strong upwards move on last week’s Non-Farm Payrolls but couldn’t break the resistance line. These moves came on top of US weakness and not on an improvement in Europe. Yohay already wrote about these issues earlier this week on forexcrunch . Now let’s look at another technical aspect.

Looking at the hourly chart, we can see a rising uptrend channel that accompanied the Euro in the past week. This can be seen in the graph. The top of this uptrend channel was challenged more than 3 times, and is very clear. As the Euro climbed upwards, it closely followed this top border.
The bottom border of this line was approached three times. While the pair stayed away from this line during most of the week, it closed at 1.2639, quite close to it. Together with the failure to making a convincing break above 1.2672 (which was the peak on May 21st) and settling at the bottom of the uptrend channel, this shows again that EUR/USD is out of air.
Apart for the regular events that are expecting us (detailed in the Euro dollar forecasts), there’s a very important one-time event on July 23rd – results of the bank stress tests. This will determine how the European banks are dealing with the debt crisis, the big issue looming over the Euro-zone in the past few months.
Saturday, July 10, 2010
AUD/USD Weekly Technical Forecast (July 12-16 2010)
A variety of Australian releases and one Chinese release will move the Aussie in the upcoming week. Here’s an outlook for the Australian events, and an updated technical analysis for AUD/USD, now in higher ground.
AUD/USD daily chart with support and resistance lines. Click to enlarge:
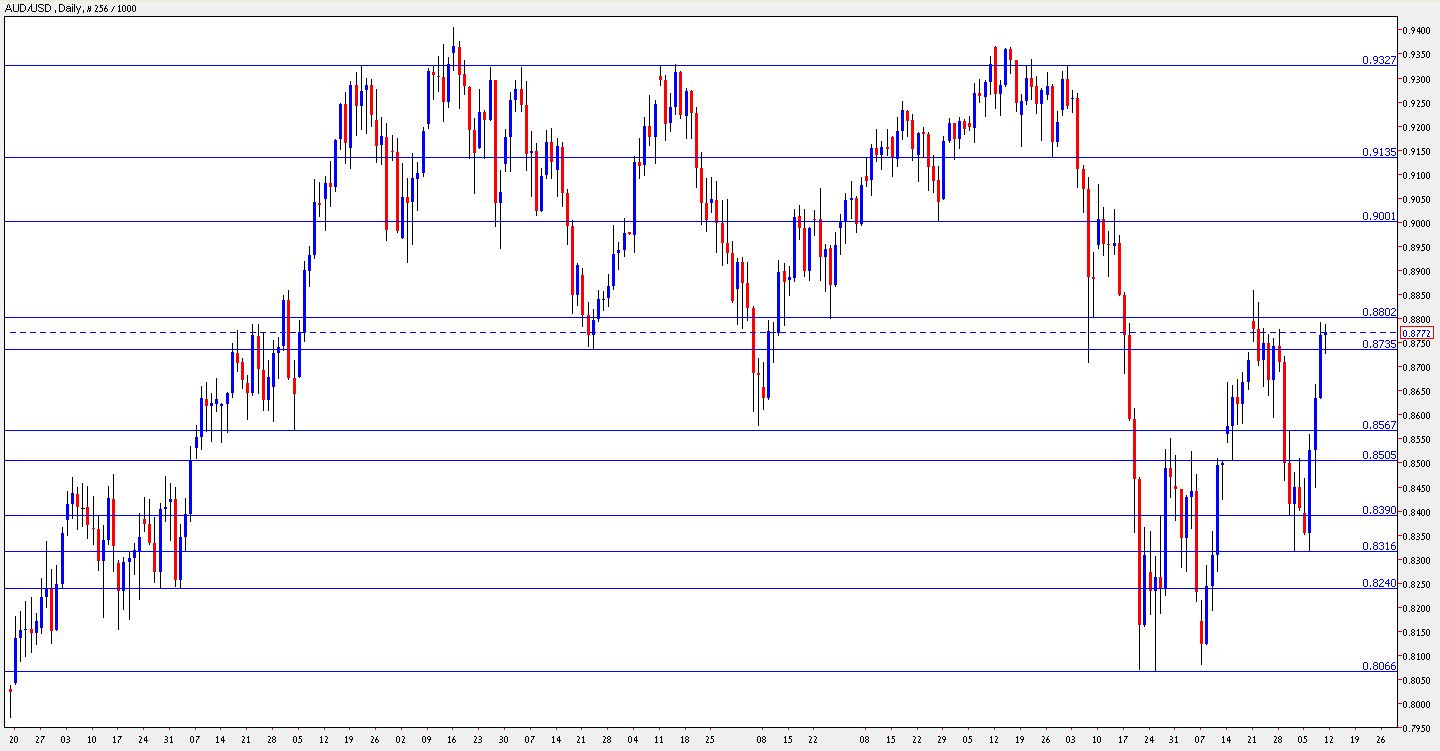
The Australian economy enjoys a bubbling job market. The fresh figures came out significantly better than expected, and this gave a big boost to AUD/USD. Will this continue? Let’s start:
- Home Loans: Published on Monday at 1:30 GMT. This important housing indicator reflects the impact of the rate hikes – less people are taking loans due to the high interest rate. After 7 consecutive months of drops, the number of loans is finally expected to rise, but at a very modest scale – 0.1%. This will provide a shaky start for AUD/USD at the beginning of the new week.
- NAB Business Confidence: Published on Tuesday at 1:30 GMT. National Australia Bank has shown a significant drop in business confidence in the past three months – a drop from 19 to 5 points, although still positive, still showing optimism. This survey of 350 businesses will probably show another drop this time.
- Westpac Consumer Sentiment: Published on Wednesday at 1:30 GMT. Westpac’s survey deals with the consumers. 1,200 consumers have shown less confidence in the past three months, with sharp drops of 5.7% and 7% in the past two months. This time, a small rise is expected.
- MI Inflation Expectations: Published on Thursday at 1:30 GMT. The Melbourne Institute fills in for the gap created by the government, that publishes the CPI only once per quarter. According to MI, inflation is now weaker – 3.4% in comparison to a strong 4.1% figure three months ago. A drop under 3% will weaken the Aussie.
- New Motor Vehicle Sales: Published on Thursday at 1:30 GMT. Vehicle sales are a strong indicator of consumption, but this indicator tends to be very volatile. After a rise of 8.4% two months ago, a drop of 3.2% was seen last month. A small rise is predicted now.
- Chinese GDP: Published on Thursday at 2:00 GMT. Australia’s main partner continued to grow rapidly while the West suffered from economic contraction. In the past two quarters, the growth rate return to double digits: 10.5% in Q4 of 2009 and 11.9% in Q1. China releases the figures for Q2 quite early. They’re expected to show a growth rate of 10.5%, still very strong. The Aussie will gain from a stronger rise.
AUD/USD Technical Analysis
The Aussie had a bad start to the week, testing the 0.8315 support line, which it also tested in the previous week. It then began a rally during which it broke many resistance lines and eventually bounced at the resistance line 0f 0.88.
The Aussie is now in a tight range between 0.8735 (December’s low) and the round number of 0.88 which it just tested. Note that some lines have changed since last week’s outlook.
Below 0.8735, the next support line is 0.8567, which served as a strong support line during many months in the past year, and recently worked as a pivotal line. Below, 0.8505 is a minor support line.
Lower, 0.8390 worked as a minor support line in recent months. It’s followed by 0.8315, which was a double bottom in the past two weeks – this makes it a strong line of support now.
Even lower, 0.8240 is an old line of resistance that now serves as a support line, and its followed by the year-to-date low of 0.8066.
Looking up above 0.88, the next line of resistance is the round number of 0.90, which was tested in March and in May. Higher, 0.9327 is a very strong line of resistance which held the Aussie back lots of times in the past year.
Even higher, 0.94 was the 2009 high and its followed by the round number of 0.95, but they’re still far.
I remain bullish on the Aussie.
Once again, we’ve seen that the Australia is doing great – the economy gained lots of jobs. We’ll now probably see that Australia’s main trade partner, China, is also doing well, and this is likely to provide further strength for the Aussie.
AUD/USD Weekly Technical Forecast (July 12-16 2010)
A variety of Australian releases and one Chinese release will move the Aussie in the upcoming week. Here’s an outlook for the Australian events, and an updated technical analysis for AUD/USD, now in higher ground.
AUD/USD daily chart with support and resistance lines. Click to enlarge:
The Australian economy enjoys a bubbling job market. The fresh figures came out significantly better than expected, and this gave a big boost to AUD/USD. Will this continue? Let’s start:
- Home Loans: Published on Monday at 1:30 GMT. This important housing indicator reflects the impact of the rate hikes – less people are taking loans due to the high interest rate. After 7 consecutive months of drops, the number of loans is finally expected to rise, but at a very modest scale – 0.1%. This will provide a shaky start for AUD/USD at the beginning of the new week.
- NAB Business Confidence: Published on Tuesday at 1:30 GMT. National Australia Bank has shown a significant drop in business confidence in the past three months – a drop from 19 to 5 points, although still positive, still showing optimism. This survey of 350 businesses will probably show another drop this time.
- Westpac Consumer Sentiment: Published on Wednesday at 1:30 GMT. Westpac’s survey deals with the consumers. 1,200 consumers have shown less confidence in the past three months, with sharp drops of 5.7% and 7% in the past two months. This time, a small rise is expected.
- MI Inflation Expectations: Published on Thursday at 1:30 GMT. The Melbourne Institute fills in for the gap created by the government, that publishes the CPI only once per quarter. According to MI, inflation is now weaker – 3.4% in comparison to a strong 4.1% figure three months ago. A drop under 3% will weaken the Aussie.
- New Motor Vehicle Sales: Published on Thursday at 1:30 GMT. Vehicle sales are a strong indicator of consumption, but this indicator tends to be very volatile. After a rise of 8.4% two months ago, a drop of 3.2% was seen last month. A small rise is predicted now.
- Chinese GDP: Published on Thursday at 2:00 GMT. Australia’s main partner continued to grow rapidly while the West suffered from economic contraction. In the past two quarters, the growth rate return to double digits: 10.5% in Q4 of 2009 and 11.9% in Q1. China releases the figures for Q2 quite early. They’re expected to show a growth rate of 10.5%, still very strong. The Aussie will gain from a stronger rise.
AUD/USD Technical Analysis
The Aussie had a bad start to the week, testing the 0.8315 support line, which it also tested in the previous week. It then began a rally during which it broke many resistance lines and eventually bounced at the resistance line 0f 0.88.
The Aussie is now in a tight range between 0.8735 (December’s low) and the round number of 0.88 which it just tested. Note that some lines have changed since last week’s outlook.
Below 0.8735, the next support line is 0.8567, which served as a strong support line during many months in the past year, and recently worked as a pivotal line. Below, 0.8505 is a minor support line.
Lower, 0.8390 worked as a minor support line in recent months. It’s followed by 0.8315, which was a double bottom in the past two weeks – this makes it a strong line of support now.
Even lower, 0.8240 is an old line of resistance that now serves as a support line, and its followed by the year-to-date low of 0.8066.
Looking up above 0.88, the next line of resistance is the round number of 0.90, which was tested in March and in May. Higher, 0.9327 is a very strong line of resistance which held the Aussie back lots of times in the past year.
Even higher, 0.94 was the 2009 high and its followed by the round number of 0.95, but they’re still far.
I remain bullish on the Aussie.
Once again, we’ve seen that the Australia is doing great – the economy gained lots of jobs. We’ll now probably see that Australia’s main trade partner, China, is also doing well, and this is likely to provide further strength for the Aussie.
Wednesday, July 7, 2010
EUR/USD Pusing Forward to Touch 1.27..
EUR/USD continued pushing forward and touched 1.27. At this point, it seems that the heights aren’t easy for the pair, that still carries debt issues and gloomy forecasts. Update on this pair.
Euro/Dollar continued the trend that began with the weak Non-Farm Payrolls on Friday and gradually edged up during the week – from the support line of 1.2460, it rose in waves and reached 1.2702, breaking 30 pips above the 1.2672 peak it reached on May 21, in the recovery rally that followed the turmoil.
So, at this point, the highest since the beginning of May, the pair seems exhausted. EUR/USD fell back down to 1.2660 after reaching the new highs. The break seems false and the next line of resistance, 1.2880 is out of reach. 1.2880 was a support line in May 2009.
Below 1.2460, support appears at 1.2330, 1.2250 and most importantly 1.2150. Above, 1.3110 is the next resistance line.
Reasons for Euro rally
The recent Euro rally came on top of weak economic figures in the US, and especially the Non-Farm Payrolls, that disappointed two months in a row. The sentiment is that the US economic recovery is much weaker than expected, meaning low interest rates for a very extended period of time. With a weak US economy, how can the dollar rise?
But there’s something else: the risk factor. The Euro didn’t rally on its own strength, but on US weakness. US weakness is global weakness, and this will eventually trigger risk aversive trading.
The situation in the Euro-zone isn’t good. The European teams might be good football / soccer, but their economies aren’t doing well.
Top economists say that the worst is yet to come:
When fear will return to the markets, the Euro will suffer. The dollar and the yen will rise. So, if you’re enjoying this current risk rally, you better watch out before the tables turn once again.
Euro/Dollar continued the trend that began with the weak Non-Farm Payrolls on Friday and gradually edged up during the week – from the support line of 1.2460, it rose in waves and reached 1.2702, breaking 30 pips above the 1.2672 peak it reached on May 21, in the recovery rally that followed the turmoil.
So, at this point, the highest since the beginning of May, the pair seems exhausted. EUR/USD fell back down to 1.2660 after reaching the new highs. The break seems false and the next line of resistance, 1.2880 is out of reach. 1.2880 was a support line in May 2009.
Below 1.2460, support appears at 1.2330, 1.2250 and most importantly 1.2150. Above, 1.3110 is the next resistance line.
Reasons for Euro rally
The recent Euro rally came on top of weak economic figures in the US, and especially the Non-Farm Payrolls, that disappointed two months in a row. The sentiment is that the US economic recovery is much weaker than expected, meaning low interest rates for a very extended period of time. With a weak US economy, how can the dollar rise?
But there’s something else: the risk factor. The Euro didn’t rally on its own strength, but on US weakness. US weakness is global weakness, and this will eventually trigger risk aversive trading.
The situation in the Euro-zone isn’t good. The European teams might be good football / soccer, but their economies aren’t doing well.
Top economists say that the worst is yet to come:
Shaun Osborne, chief currency strategist at TD Securities Inc. in Toronto, said the euro will depreciate to $1.13 in the third quarter, $1.08 by year-end and may near $1 in 2011 before recovering. Osborne, whose predictions were within 4.1 percent of the mark on average, according to data compiled by Bloomberg, was echoed by the nine following most-accurate forecasters in anticipating a lower euro in the next two quarters.
When fear will return to the markets, the Euro will suffer. The dollar and the yen will rise. So, if you’re enjoying this current risk rally, you better watch out before the tables turn once again.
Sunday, June 20, 2010
USD/CAD Weekly Technical Forecast (June 21-25 2010)
The loonie enjoyed risk appetite for a second week in a row. This week consists of key indicators for the next rate decision. Here’s an outlook for Canadian events and an updated technical analysis for USD/CAD, which is closer to parity once again.
USD/CAD chart with resistance and support lines on it. Click to enlarge:

The markets disregard the European trouble (with focus now on Spain again) and seek “risky” currencies. The Canadian dollar also enjoys the rising price of oil, and his its eyes on parity. Prices need to rise in other areas in order to push inflation. Let’s start:
- CPI: Published on Tuesday at 11:00 GMT. A rise in the consumer price index is necessary for further rate hikes, after the BOC made its first move. Current inflation conditions are still tame. CPI rose by 0.3% last month after remaining unchanged beforehand, and Core CPI, which is also closely watched by the central bank, also rose by 0.3%. More modest rises are expected this time.
- Retail Sales: Published on Wednesday at 12:30 GMT. This major consumer indicator made a surprising jump last month – 2.1% instead of 0.2% that was predicted. Also the core figure was a big surprise, jumping by 1.7%. Yet again, the expectations remain modest, with a rises of less than 1% predicted in both indicators.
USD/CAD Technical Analysis
The Canadian dollar continued the trend from last week, and after falling below 1.04, USD/CAD continued to fall gradually towards the next support line – 1.02, which it closed very close to, at 1.0210.
1.02 continues to be a dominant line – this was the 2009 low and also a line of resistance when the pair reached parity. A break below 1.02 will send the pair towards minor support at 1.01 (a line that was added on last week’s outlook).
Below 1.01 comes the ultimate support line – parity. USD/CAD parity was last seen in April but didn’t hold for too long. Lower, 0.98 is a minor line of support, followed by 0.97. A bigger surge in oil prices is necessary for the pair to approach these areas.
Looking up, the immediate resistance line is at 1.0560, which served as a line of support and resistance in recent weeks. Higher, 1.0750 was the high line of long time range, and was also tested about a month ago. It’s followed by 1.0850, which was a swing high before the pair went lower.
I remain bearish on USD/CAD.
As the fear factor leaves the markets, the Canadian dollar, with a growing economy, receives the strength it deserves. Next stop – parity.
Famous Posts
- Dividends4Life: Three Problems Dividend Investors Face (DIV) | Investors Club - Zentrica.net
- Can Someone Edit This Div Layout For Me? - td - Edit - Layout.................... - Someone - This - Search 3G
- Text a $10 Donation to Support the New York Public Library; Facing “Harshest” Budget Cut in Its History « ResourceShelf
- Forex – USD/CAD weekly outlook: June 21-25 By ForexPros.com
- Small Business: Guide to the Mental Health Parity Law | FavStocks
Saturday, June 12, 2010
Forex Charts - Make Bigger Profits by Following These Key Points
Forex charts are a great, time efficient and proven way to make bigger profits but most traders don't use them correctly and here we will give you some key points to help you make bigger profits...
Let's look at some key points for more profitable technical analysis with forex charts.
If you look at any forex chart you will see big trends that can last for many months and trend following these can be very profitable and if you want to make money out of them you must understand this key fact:
Most big trends start and continue from breakouts to new highs and lows on the chart and you must go with these breaks - most traders don't. They want to wait for the pullback and of course it never comes and they are left behind. While it appears like you have missed the first part of the move, the odds of continuation are high so go with them.
Always be patient when using forex charts. You don't get rewarded for your efforts or how many times you trade but being right with your trading signal. I know traders who trade just a few times a month yet make triple digit gains - so wait for the right opportunities.
When you have a trend you want to hit always check price momentum is on your side and make sure that you use momentum indicators that show price acceleration in the direction you wish to trade. Two great ones, you can learn, in about 30 minutes are - the stochastic and RSI. These two combined will increase your odds of success by getting the odds more on your side.
Never believe anyone who tells you there is a mathematical formula for market movement - there isn't. If of course there was, we would all know the price in advance and there would be no market. So forget trying to predict and only trade the reality of price.
Its probabilities that you need to understand and like a successful poker player, you won't win every hand - but if you keep trading the odds, you will win long term. When using forex charts, the simpler your forex trading method the better, as simple systems tend to be very robust and have fewer elements to break, than complicated ones.
I have used a simple breakout method which uses trend lines, RSI and the stochastic and made money with it for over 20 years sure, it's simple but it works. Forex charts give you the reality of price before your eyes and you can spot areas of over valuation and under valuation. Humans create trends and they also (due to their emotions) push trends to far up or down in either direction.
You can of course ride trends - but you will also see big price spikes and history tells you they don't last long and taking trades contrary to the majority can be very profitable. Charting is an art not a science and you need to practice your art. The successful captain of a ship uses charts to navigate safely, but he also knows that use them wrongly and he will drown and it's a very similar situation in forex.
The Good News
You can learn forex charting in around 2 weeks and soon be piling up big profits in around 30 minutes a day spotting and hitting high odds trades and enjoying great profits. The good news is forex trading and using technical analysis is a learned skill and one you can master with a little practice.
Let's look at some key points for more profitable technical analysis with forex charts.
If you look at any forex chart you will see big trends that can last for many months and trend following these can be very profitable and if you want to make money out of them you must understand this key fact:
Most big trends start and continue from breakouts to new highs and lows on the chart and you must go with these breaks - most traders don't. They want to wait for the pullback and of course it never comes and they are left behind. While it appears like you have missed the first part of the move, the odds of continuation are high so go with them.
Always be patient when using forex charts. You don't get rewarded for your efforts or how many times you trade but being right with your trading signal. I know traders who trade just a few times a month yet make triple digit gains - so wait for the right opportunities.
When you have a trend you want to hit always check price momentum is on your side and make sure that you use momentum indicators that show price acceleration in the direction you wish to trade. Two great ones, you can learn, in about 30 minutes are - the stochastic and RSI. These two combined will increase your odds of success by getting the odds more on your side.
Never believe anyone who tells you there is a mathematical formula for market movement - there isn't. If of course there was, we would all know the price in advance and there would be no market. So forget trying to predict and only trade the reality of price.
Its probabilities that you need to understand and like a successful poker player, you won't win every hand - but if you keep trading the odds, you will win long term. When using forex charts, the simpler your forex trading method the better, as simple systems tend to be very robust and have fewer elements to break, than complicated ones.
I have used a simple breakout method which uses trend lines, RSI and the stochastic and made money with it for over 20 years sure, it's simple but it works. Forex charts give you the reality of price before your eyes and you can spot areas of over valuation and under valuation. Humans create trends and they also (due to their emotions) push trends to far up or down in either direction.
You can of course ride trends - but you will also see big price spikes and history tells you they don't last long and taking trades contrary to the majority can be very profitable. Charting is an art not a science and you need to practice your art. The successful captain of a ship uses charts to navigate safely, but he also knows that use them wrongly and he will drown and it's a very similar situation in forex.
The Good News
You can learn forex charting in around 2 weeks and soon be piling up big profits in around 30 minutes a day spotting and hitting high odds trades and enjoying great profits. The good news is forex trading and using technical analysis is a learned skill and one you can master with a little practice.
Famous Posts
Subscribe to:
Posts (Atom)