Sunday, September 5, 2010

The Pound showed weakness in the past week, and is now facing important tests. The upcoming week consists of a rate decision among other important releases. Here’s an outlook for the British events and an updated technical analysis for GBP/USD.

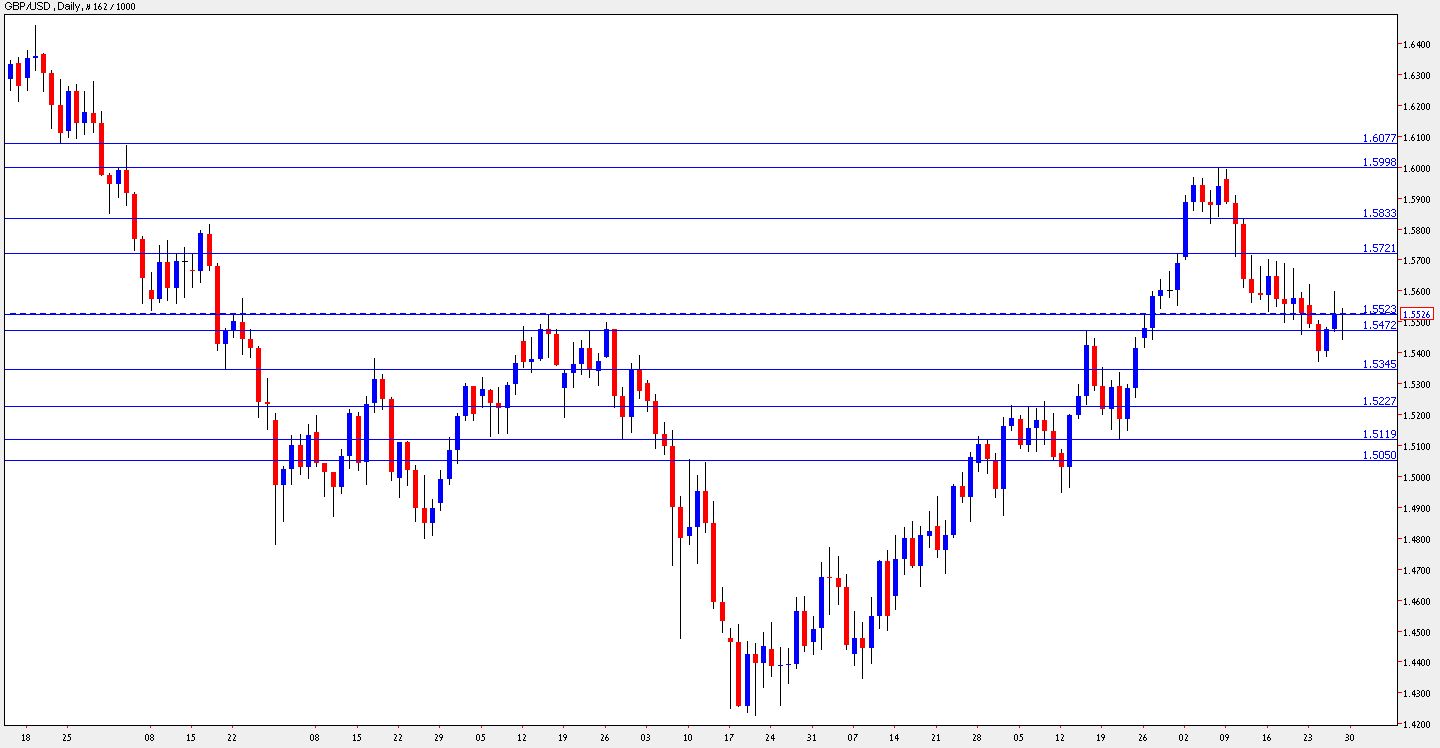
GBP/USD daily graph with support and resistance lines on it. Click to enlarge:

gbp usd forecast

When the dollar strengthened on Friday’s Non-Farm Payrolls, the Pound suffered. When the dollar later retreated on the disappointing services PMI, the Pound only partially recovered. This is a sign of its weakness. Will it continue downwards this week? Let’s see:

  1. Halifax HPI: Publication time unknown. Delayed from last week. This house price index, is one of the most accurate available, as it’s based on internal data from HBOS, one of the biggest banks in Britain. According to the bank, a three month slump in house prices stopped last month with a neat 0.6% rise. But this time, a 0.3% drop is predicted.

  2. BRC Retail Sales Monitor: Published on Monday at 23:00 GMT. This indicator serves as hint for the official retail sales figure. It measures the change in volume of sales, but only for the members of the BRC. The index rose nicely in the past three months, but could dip this time, especially after last month’s growth was weak.

  3. Manufacturing Production: Published on Wednesday at 8:30 GMT. Manufacturing output disappointed is the past three months by falling short of expectations, or even dropping. This gauge of the economy always rocks the Pound. Last month’s 0.3% rise will probably be followed by a similar rise this time. Note that manufacturing is part of the wider industrial production figure (expected to rise by 0.4% after dropping by 0.5% last time), but manufacturing is in the limelight.

  4. NIESR GDP Estimate: Published on Wednesday at 14:00 GMT. The National Institute of Economic and Social Research publishes its highly regarded estimate of GDP every month, filling in the gap for the official government releases. The estimate for the three months that ended in July stood on 0.9%,  lower than the official 1.2% growth seen in Q2. We’ll now get news about the three months that ended in August – more information about the third quarter.

  5. Trade Balance: Published on Thursday at 8:30 GMT. Britain’s deficit fell from 8 to 7.4 billion last month, boosting the Pound. This time, it’s expected to slip back up to 7.5 billion. A big disappointment can definitely hurt the Pound, as it happened when trade balance deficit jumped in May.

  6. Rate decision: Published on Thursday at 11:45 GMT.  There’s still only a single member of the MPC that voted for a rate hike – Andrew Sentance. This came in response to the rising inflation, which has weakened recently, as Mervyn King had expected. So, the chances of a rate hike are lower now. The British Official Bank ate will probably stay at 0.50% once again. The wording of the MPC Rate Statement will be interesting to watch, as it may signal the roadmap for an exit strategy.

  7. PPI: Published on Friday at 8:30 GMT. PPI Input, the secondary indicator of inflation was negative in the past three months, showing a significant drop in prices. The surprising drop of 1% last month will probably be followed by a 0.2% rise this time. Only a big leap will send a signal that also consumer inflation is on the rise, but this is unlikely – it will probably remain contained – showing that there’s no pressure for a rate hike. PPI Output is also expected to post a small gain – 0.1%.

  8. CB Leading Index: Published on Friday at 9:00 GMT. This composite index of 7 economic indicators is based on data that has already been released. Nevertheless, it still has an impact on cable. Last month it rose by 0.5%, and the rise will probably be more moderate now.


GBP/USD Technical Analysis

The Pound began the week with a failed attempt to stabilize above 1.5520 (mentioned in last week’s outlook). After this failed, GBP/USD lost 1.5470 and continued downwards, supported by the 1.5350 line. A recovery on Friday found it struggling with the 1.5470 line from the other side, and it closed at 1.5450.

The Pound fell to a lower range – between 1.5470 which also capped the pair in July, and 1.5520, which was a peak in April and now serves as minor resistance.

Looking up, 1.5720, which supported the pair back in 2009 is the next line of resistance. Above, 1.5833, which provided support at the beginning of the year and later worked as resistance, is the next line. Higher, the psychological round number of 1.60 proved to be a tough barrier and is the highest level in 6 months.

Higher, 1.6080 is the next minor resistance line, after working as support in January. It’s followed by 1.6270, but that’s quite far at the moment.

Looking down,  1.5230 was a stubborn resistance line in July and is now a major support line. Lower, 1.5120 will provide further support after having this role in July.

The 1.5050 line capped the pair on a recovery attempt in May, and is now a minor support line. Lower, 1.4950 provided support in July and is the final line for now.

I remain bearish on GBP/USD.

Inflation has softened and doesn’t support a rate hike. Together the pause in employment improvement, the Pound is vulnerable to further losses.

GBP/USD Weekly Technical Forecast (SEP 6-10)

The Pound showed weakness in the past week, and is now facing important tests. The upcoming week consists of a rate decision among other important releases. Here’s an outlook for the British events and an updated technical analysis for GBP/USD.

GBP/USD daily graph with support and resistance lines on it. Click to enlarge:

gbp usd forecast

When the dollar strengthened on Friday’s Non-Farm Payrolls, the Pound suffered. When the dollar later retreated on the disappointing services PMI, the Pound only partially recovered. This is a sign of its weakness. Will it continue downwards this week? Let’s see:

  1. Halifax HPI: Publication time unknown. Delayed from last week. This house price index, is one of the most accurate available, as it’s based on internal data from HBOS, one of the biggest banks in Britain. According to the bank, a three month slump in house prices stopped last month with a neat 0.6% rise. But this time, a 0.3% drop is predicted.

  2. BRC Retail Sales Monitor: Published on Monday at 23:00 GMT. This indicator serves as hint for the official retail sales figure. It measures the change in volume of sales, but only for the members of the BRC. The index rose nicely in the past three months, but could dip this time, especially after last month’s growth was weak.

  3. Manufacturing Production: Published on Wednesday at 8:30 GMT. Manufacturing output disappointed is the past three months by falling short of expectations, or even dropping. This gauge of the economy always rocks the Pound. Last month’s 0.3% rise will probably be followed by a similar rise this time. Note that manufacturing is part of the wider industrial production figure (expected to rise by 0.4% after dropping by 0.5% last time), but manufacturing is in the limelight.

  4. NIESR GDP Estimate: Published on Wednesday at 14:00 GMT. The National Institute of Economic and Social Research publishes its highly regarded estimate of GDP every month, filling in the gap for the official government releases. The estimate for the three months that ended in July stood on 0.9%,  lower than the official 1.2% growth seen in Q2. We’ll now get news about the three months that ended in August – more information about the third quarter.

  5. Trade Balance: Published on Thursday at 8:30 GMT. Britain’s deficit fell from 8 to 7.4 billion last month, boosting the Pound. This time, it’s expected to slip back up to 7.5 billion. A big disappointment can definitely hurt the Pound, as it happened when trade balance deficit jumped in May.

  6. Rate decision: Published on Thursday at 11:45 GMT.  There’s still only a single member of the MPC that voted for a rate hike – Andrew Sentance. This came in response to the rising inflation, which has weakened recently, as Mervyn King had expected. So, the chances of a rate hike are lower now. The British Official Bank ate will probably stay at 0.50% once again. The wording of the MPC Rate Statement will be interesting to watch, as it may signal the roadmap for an exit strategy.

  7. PPI: Published on Friday at 8:30 GMT. PPI Input, the secondary indicator of inflation was negative in the past three months, showing a significant drop in prices. The surprising drop of 1% last month will probably be followed by a 0.2% rise this time. Only a big leap will send a signal that also consumer inflation is on the rise, but this is unlikely – it will probably remain contained – showing that there’s no pressure for a rate hike. PPI Output is also expected to post a small gain – 0.1%.

  8. CB Leading Index: Published on Friday at 9:00 GMT. This composite index of 7 economic indicators is based on data that has already been released. Nevertheless, it still has an impact on cable. Last month it rose by 0.5%, and the rise will probably be more moderate now.


GBP/USD Technical Analysis

The Pound began the week with a failed attempt to stabilize above 1.5520 (mentioned in last week’s outlook). After this failed, GBP/USD lost 1.5470 and continued downwards, supported by the 1.5350 line. A recovery on Friday found it struggling with the 1.5470 line from the other side, and it closed at 1.5450.

The Pound fell to a lower range – between 1.5470 which also capped the pair in July, and 1.5520, which was a peak in April and now serves as minor resistance.

Looking up, 1.5720, which supported the pair back in 2009 is the next line of resistance. Above, 1.5833, which provided support at the beginning of the year and later worked as resistance, is the next line. Higher, the psychological round number of 1.60 proved to be a tough barrier and is the highest level in 6 months.

Higher, 1.6080 is the next minor resistance line, after working as support in January. It’s followed by 1.6270, but that’s quite far at the moment.

Looking down,  1.5230 was a stubborn resistance line in July and is now a major support line. Lower, 1.5120 will provide further support after having this role in July.

The 1.5050 line capped the pair on a recovery attempt in May, and is now a minor support line. Lower, 1.4950 provided support in July and is the final line for now.

I remain bearish on GBP/USD.

Inflation has softened and doesn’t support a rate hike. Together the pause in employment improvement, the Pound is vulnerable to further losses.

AUD/USD Weekly Technical Forecast (Sep 6-10 2010)

After a great week, another busy one expects Aussie traders. The RBA’s rate decision and employment figures are the highlights. Here’s an outlook for Australian events and an updated technical analysis for AUD/USD.

AUD/USD daily graph with support and resistance lines on it. Click to enlarge:

aud usd forecast

The Aussie enjoyed lots of good figures, with the Q2 GDP growth of 1.2% being a great positive surprise. The better-than-expected retail sales figure and especially building approvals, showed that also in Q3, the Australian economy is warming up once again. Will this lead to a renewal of rate hikes?

  1. MI Inflation Gauge: Published on Monday at 12:30 GMT. The Melbourne Institute’s inflation gauge fills in for the government, that publishes an official inflation figure only once per quarter. According to MI, inflation slowed down from 0.5% three months ago, down to 0.1% last month. A similar 0.1% rise is expected this time.

  2. ANZ Job Advertisements: Published on Monday at 1:30 GMT. The amount of jobs published in the media serves as a good indicator for the official employment figures released 3 days later. Last month saw a smaller growth in ads, only 1.3%, and indeed, the gain in jobs was slower than previous months. This time, the rise in ads is expected to slightly stronger.

  3. AIG Construction Index: Published on Monday at 23:30 GMT. The Australia Industry Group showed that the construction sector is slowing down, even contracting in the past two months. The index was under the critical 50 point mark, and this shows an economic squeeze. This goes hand in hand with the slowdown in other housing sector figures – a result of the rate hikes. It’s expected to recover, but remain under 50 points this time.

  4. Rate decision: Published on Tuesday at 4:30 GMT. 4 months have passed since the last rate hike, the sixth since the financial crisis. The hikes took their toll on the economy, and especially on real estate, so Glenn Stevens and his colleagues at the RBA decided to pause on recent months. Also now, the Cash Rate is expected to remain unchanged at 4.50%. The focus will be on the accompanying statement which will hint about future moves.

  5. Home Loans: Published on Wednesday at 1:30 GMT. This important housing sector figure always rocks the Aussie. After a sharp fall of 3.9% last month and many bad months beforehand as well, the number of loans is expected to grow by 1.1% this time, boosting the Aussie.

  6. Employment data: Published on Thursday at 1:30 GMT. After months of excellent figures, last month’s employment numbers were somewhat mixed. Employment Change rose by 23.5K, slightly better than expected, but the unemployment rate jumped to 5.3%, which was a quite a disappointment. A similar gain in jobs, 25.3K is expected now. The unemployment is expected to fall back down to 5.2%. Any result will rock the Aussie.

  7. Guy Debelle talks: Starts speaking on Thursday at 3:00 GMT. RBA deputy governor Dr. Guy Debelle might say more about the fresh rate decision, and add prospects about the future. It’s important to note that in a speech last week, Debelle didn’t mention anything related to monetary policy.

  8. Chinese Trade Balance: Published during Friday. Australia’s main trade partner has a strong impact on the Aussie. This time, the trade balance of the world’s second largest economy will be closely watched. This figure is also sensitive for the value of the Chinese yuan, which is closely monitored by the US. China’s surplus is expected to squeeze from 28.7 to 26.9 billion.


AUD/USD Technical Analysis

The Australian dollar dropped gradually at the beginning of the week, and found support at the 0.8870 line (mentioned in last week’s outlook). It then made a sharp recovery, crossing 0.90 easily, struggling with 0.9080 and finally jumping above 0.9135 to close at 0.9143.

The Aussie is now bound between the 0.9135 line which worked as support back in April, and 0.9220, which was a support line in March and also capped the Aussie at the beginning of August.

Looking down, 0.9080 is the next support line. It was a double top in July and the Aussie leaped above it during a weekend. Lower, the round number of 0.90 provides support. This psychological number was also a swing low in March.

The 0.8870 line was tested in the past week and also capped the pair twice in recent months. It now serves as strong support. 0.8735 was a low point in December 2009 and also in July – minor support now.

Lower, 0.8567 was a support line back in 2009, and also worked as resistance in May. Below, 0.8316 was a double bottom in July and provides strong support. The final line is the year-to-date low 0f 0.8066.

Looking up above 0.9220, the next line is a very strong one – 0.9327. It capped the Aussie many times in the past year. A break above this line will send the pair towards immediate resistance at 0.9366, which was a stubborn line in April.

The 2009 high of 0.9405 is the next resistance line, and it’s followed by 0.95, which was last reached only in 2008.

I remain bullish on the Aussie.

The past week’s strong GDP figures, and a good outcome from the job figures on this busy Australian week, should provide the basis for further gains.

NZD/USD Weekly Technical Forecast (Sep 6-10 2010)

The kiwi expects a rather lightweight week in terms of economic indicators, so the technicals will play a bigger role. Here’s an outlook for the events in New Zealand, and an updated technical analysis for NZD/USD.

NZD/USD daily graph with support and resistance lines on it. Click to enlarge:

nzd usd kiwi forecast

The managed to break higher after frustrating. Will this trend continue?

  1. Manufacturing Sales: Published on Tuesday at 22:45 GMT. While being a rather late figure, the quarterly frequency makes this number important. New Zealand is expected to enjoy a third straight quarter of growth in the volume of sales at manufacturers gates, after 0.7% and 0.9% rises beforehand.

  2. Overseas Trade Index: Published on Thursday at 22:45 GMT. This indicator has proven very relevant for New Zealand. It measures the change in purchase power. The past two quarters were positive, with rises of 5.7% and 5.9%. Another quarter of growth is predicted now, but it will probably be more modest – 2.3%.


NZD/USD Technical Analysis

The kiwi had a bad start with a drop under 0.70. It bottomed out at 0.6947 before recovering. After a struggle with the 0.7160 line (mentioned in last week’s outlook), Friday’s move sent it temporarily above 0.72, reaching 0.7218 before closing just under 0.72.

NZD/USD is now in a narrow range between 0.7160, which was a stubborn peak in June and also in the past week, to 0.72, which also worked as support.

Below, 0.70 is a critical round number that is closely eyed by traders. Lower, 0.69 is the next line of support. It previously worked as a line of resistance in May, after the pair fell down sharply.

Below, 0.68, that was a swing low in mid-July and also held NZD/USD in February is the next support line. Lower, 0.6685 worked as support back in September and was a pivotal line in July. The final line for now is the year-to-date low of 0.6560.

Looking up, 0.7325 capped the pair during August and serves as the next resistance line if 0.72 is cleared. This is followed by  the 0.7440 region, which capped the pair when it traded higher.

Higher, 0.7523 was a swing high back in November 2009, and serves as a minor line of resistance. Even higher, the 0.7634 peak reached almost a year ago, is the final frontier for now.

I am neutral on NZD/USD this week.

Without really important data, the kiwi is likely to swing with the mood in the global markets. The earthquake that hit the country’s southern island isn’t expected to cause an earthquake in currencies.

USD/CAD Weekly Technical Forecast (SEP 6-10 2010)

A very busy week expects loonie traders, including a rate decision and employment data. Here’s an outlook for the Canadian events, and an updated technical analysis for USD/CAD.

USD/CAD daily graph with support and resistance lines on it. Click to enlarge:

canadian dollar forecast september 6 10

Canadian GDP for the second quarter, completed with the past week’s release for June, was somewhat disappointing, after two great quarters. The overall situation is still good. This week’s 7 important Canadian releases will shed a lot of light on the current situation. Let’s start:

  1. Building Permits: Published on Wednesday at 12:30 GMT. This is a volatile, yet important gauge for the Canadian economy. Last month’s 6.5% rise in permits boosted the Canadian dollar and corrected the 8.2% fall that was seen in the previous month. The see-saw is predicted to continue with a drop of 5.8%.

  2. Rate decision: Published on Wednesday at 13:00 GMT. There is no clear consensus about this rate decision. After two rate hikes, Mark Carney’s BOC is in a dilemma. On one hand, the economy is doing quite well, and there’s a fear of rising inflation. On the other hand, Canada’s main trader partner, the US, is suffering from a slowdown, that can undermine growth in Canada. So, both an unchanged Overnight Rate of 0.75% and a hike to 1% are equally possible. This means higher than normal volatility around the release. Aslo note the accompanying statement which will indicate future moves. A hike with a statement that there will be a pause from now on can weaken the loonie.

  3. Ivey PMI: Published on Wednesday at 14:00 GMT. The Richard Ivey School of Business disappointed in its last release. The score fell to 54 points, showing that purchasing managers see less expansion. A similar number is expected this time. Only a rise above 50 points, as seen three months ago, will boost the loonie.  A rise to 55.8 is expected.

  4. Housing Starts: Published on Thursday at 12:15 GMT. Complementing on the figure from the previous day, this housing figure wasn’t too good – it fell for the 4th straight month to 189K, the lowest level since February. Another curb is due now, to 185K.

  5. Trade Balance: Published on Thursday at 12:30 GMT. Canada enjoyed a surplus in its trade balance up to April, but the number then turned negative, and even deteriorated to a deficit of 1.1 billion in last month’s release. This deficit will probably squeeze to 0.8 billion. Note that the American trade balance is released at the same time, making the timing very volatile for USD/CAD.

  6. NHPI: Published on Thursday at 12:30 GMT. The last housing figure is an official release of the change in prices of new homes. After 3 months of a 0.3% rise, this stable indicator rose by only 0.1% last month. A stronger rise will probably be seen now. Due to the timing of the publication, together with the trade balance, the impact will probably be quite modest.

  7. Employment data: Published on Friday at 11:00 GMT. The best is kept for last. After three superb months of big gains in jobs, including a surge of 93K jobs one time, last month saw a correction with a loss of 9300 jobs and a rise of the unemployment rate back to the round number of 8%. A gain of 17.6K in jobs is expected now, but the unemployment rate is likely to remain unchanged at 8%.


USD/CAD Technical Analysis

The Canadian dollar had a bad start to the week – USD/CAD failed to break below 1.05 and jumped towards the stubborn 1.0680 line (mentioned also in last week’s outlook). It then made another failed attempt to go under 1.05, but on Friday, this line finally broke and USD/CAD even extended its fall below the 1.04 line.

USD/CAD now trades between support line of 1.0280 and 1.04, which was a long-term bottom border of wide range. It’s now a minor resistance line.

Looking up, the next resistance line is at 1.05, which worked as a strong support line during most of the past week. Higher, the 1.0680 line was successfully tested for a second week in a row, making it a very strong resistance line.

Above, the 1.0750 line was the top border of a long term range, and also a swing high in May. Another swing high in May, the 1.0850 line, works as the next line of resistance, after working as such back in 2009 as well.

Lower, the 2009 low of 1.02 serves as the next line of support. Below, 1.01 capped the pair after it reached parity in April, and also was a low point a few weeks ago.

The ultimate line of support is parity – which got closer in the past week. Beyond parity, 0.98 and 0.97 provide support. They’re far now.

I remain bearish on USD/CAD.

The improvement in US jobs is good for Canada as well, as the US is Canada’s main trade partner. This week is very important for the loonie. A rate hike and positive job figures can send USD/CAD for another attempt on parity.

Saturday, September 4, 2010

Non-Farm Payrolls Finally Great – No Double Dip?

Non-Farm Payrolls exceeded expectations and fell by only 54K, nearly half of early expectations. The unemployment rate rose from 9.5% to 9.6% as expected. The initial reaction was a drop of EUR/USD but it immediately rose back up. USD/JPY is going in one direction – up.

The important part of the release was the the private sector figure. Here, a gain of 67,00 was published, also significantly better than 40,000 that was predicted. And there was more good news:

A revision of July’s figure showed that Non-Farm Payrolls fell by only 54K instead of 131K initially reported. Also the private sector’s number was revised in July from 71K to 107K. All the numbers are significantly better than expected.

EUR/USD traded around 1.2840 before the release. It then fell to 1.2810, leaped to 1.2875 and fell back again. It’s currently looking for a direction. We could see a relief rally on EUR/USD and stocks.

The Japanese yen, that has a low yield and is also a “safe haven” currency fell sharply. USD/JPY jumped from 84.40 to 85.20 after the release – no choppy trading – just one direction – up, according to scenario #2 in the Non-Farm Payrolls preview.

As written in the preview, this publication of Non-Farm Payrolls is a test for the fears of a double-dip recession. Did this calm the markets? As always, analysts will debate over this for some time. A recovery in jobs is the key to recovery.

Sunday, August 29, 2010

Coordinated Intervention To Weaken the Yen?

The Bank of Japan announced an immediate emergency meeting to begin very soon – Monday 00:00 GMT. There are expectations for new easing steps to boost the economy. But there might be more – Will we see a global coordinated intervention to weaken the yen? Yen crosses are already on the rise.

The governor of the BOJ, Masaaki Shirakawa, shortened his visit in Jackson Hole, where he met other central bankers, and returned swiftly to Japan. At 00:00 GMT, or 9:00 Japanese time, the BOJ is meeting for an emergency meeting. It happens as the week begins in Japan, and very early for JPY crosses in other places in the world:

The rather new Japanese government is showing growing vocal concern about the strength of the yen. USD/JPY recently reached fresh 15 year lows. This hurts the Japanese economy, that is based on exports.

The Japanese government, led by Naoto Kan, pushed the BOJ to take measures, and did it in  a public manner. It is also expected to declare a new stimulus program of its own, in a meeting on Tuesday.

But the BOJ doesn’t wait for Tuesday. According to expectations, the bank might enlarge its existing lending encouraging plan:
The central bank may expand a three-month 0.1 percent loan facility, increasing the supply of funds from 20 trillion yen ($230 billion) or extend the duration of loans to six months, Dow Jones reported.

Coordinated Intervention?

But there might be more under the hood. There’s talk  that the BOJ will intervene directly in the markets to weaken the yen. As we know from various examples, central bank interventions are short-lived. The Swiss National Bank lost a lot of money on its interventions.

The meeting of many central bankers from all over the world in the Jackson Hole Symposium raises the question of a coordinated effort to weaken the yen. Together with central banks in the US and Europe, a move to weaken the yen might be successful.

Similar coordinated moves in the past had significant success. The US might support this move also as a maneuver against China, which keeps it’s currency, the yuan, weak, angering the US.

In the meantime, the Japanese yen weakens on thin trading. USD/JPY rose to 85.70, GBP/JPY rose above 133, EUR/JPY touched 109.25 and CHF/JPY reached 83.40.

This is a very early hour in the week – only the Sydney session is open at the time of writing. The Tokyo session will open soon. Later, there’s a bank holiday in Britain.

Thin trading is a good timing for an intervention.

The BOJ will hold a press conference at 5:30 GMT, and we’ll get to know what’s going on. An announcement of further easing steps is likely to weaken the yen only marginally. A coordinated intervention will send all JPY crosses to the skies.

EUR/USD Weekly Technical Forecast (Aug 30-Sep 03)

The calendar is packed for the Euro in the upcoming week, with the rate decision being the highlight. Here’s an outlook for European events and an updated technical analysis for the ranging EUR/USD.

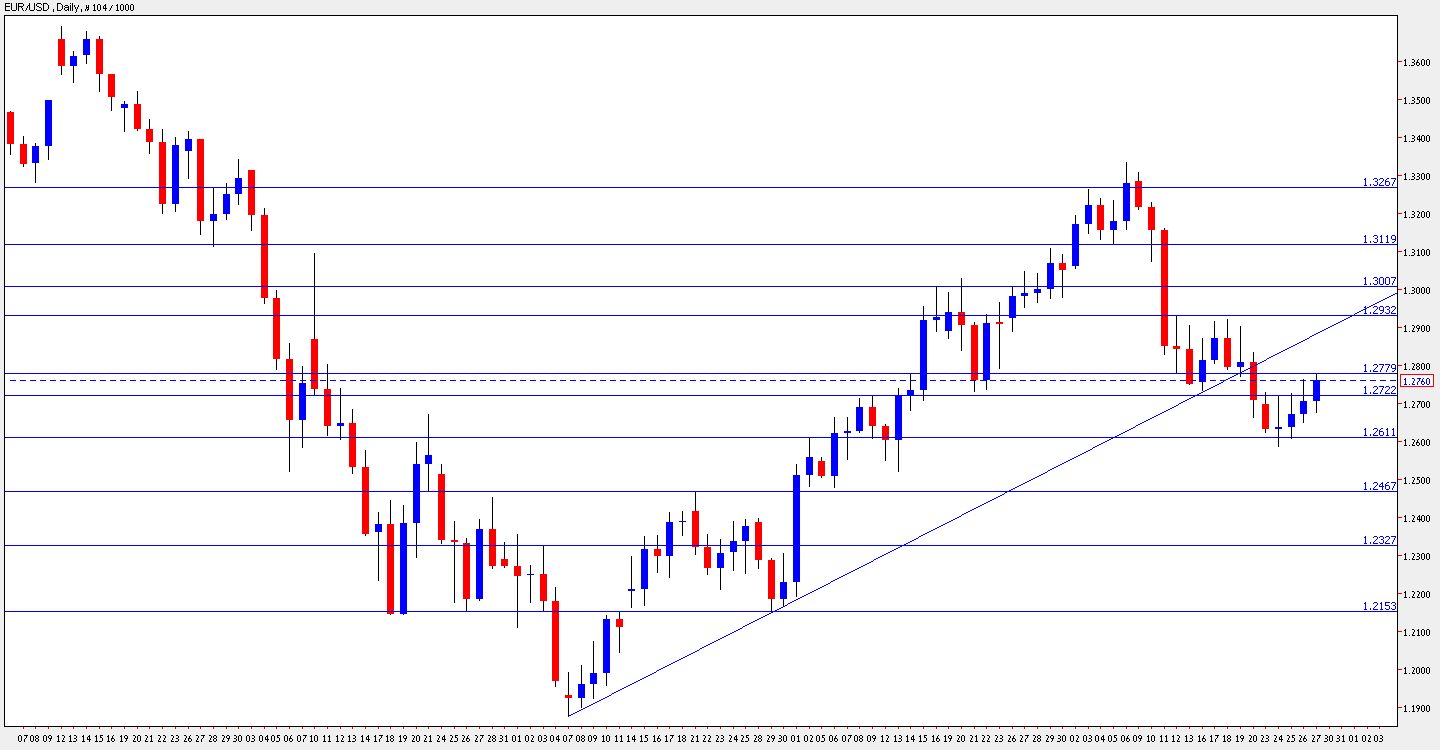
EUR/USD daily chart with support and resistance lines marked. Click to enlarge:

eur usd forecast

Echoes from the downwards revision of US GDP and also from Bernanke’s speech in Jackson Hole will still move the pair at the beginning of the week. Later, the news will start shaping trading. Let’s start:

  1. German Unemployment Change: Published on Tuesday at 7:55 GMT. The German economy enjoyed outstanding performance in recent months, and this is well reflected in the change in unemployed people. It rose only twice in the past year, and almost always dropped more than expected. Also now, a drop of 19K is predicted, similar to last month’s 20K drop.

  2. Unemployment Rate: Published on Tuesday at 9:00 GMT. In sharp contrast to Germany, most of the other countries in the Euro zone are lagging behind. The European unemployment rate is around 10% for many months, and is expected to remain so now as well, weakening the Euro.

  3. CPI Flash Estimate: Published on Tuesday at 9:00 GMT. Slightly overshadowed by the unemployment rate, this initial release of inflation for August is expected to show that the annual rate of inflation in the Euro zone eased from 1.7% to 1.6%. Only a rise above 2% will spark talks about a possible rate hike somewhere in the future.

  4. German Retail Sales: Published on Wednesday at 6:00 GMT.  After a superb rise of 3% two months ago, this consumer figure corrected with a 0.3% drop last month. A rise of 0.6% is expected now, showing that German consumers are on the move.

  5. Final Manufacturing PMI: Published on Wednesday at 8:00 GMT. According to the initial release, manufacturing slowed from 56.7 to 55 points last month, but still at a healthy pace. This is likely to be confirmed now.

  6. Revised GDP: Published on Thursday at 9:00 GMT. The great growth rate of 1% in the Euro zone will probably be confirmed now. Germany, the locomotive of the zone, already confirmed its stellar 2.2% growth in Q2.

  7. Rate decision: Published on Thursday at 11:45 GMT. Jean-Claude Trichet faces impressing (though uneven) growth in the Euro-zone in Q2, and also steadily rising inflation. On the other hand, the prospects for the near future aren’t too good, especially with remainders of the debt crisis still curbing growth. He is likely to leave the Minimum Bid Rate on 1% for another month. The focus will be on the tone of his words in the press conference that he is due to hold 45 minutes later. He’ll probably express concern over the situation in the US, and commit himself to maintaining the recovery – meaning willingness to more easing steps, though no immediate actions.

  8. Final Services PMI: Published on Friday at 8:00 GMT. Europe’s services sector remained almost unchanged according to the initial release  - an insignificant drop from 55.8 to 55.6 points. This will probably be confirmed now. Only a drop under 50 will be meaningful.

  9. Retail Sales: Published on Friday at 9:00 GMT. Though published after the German figure was already released, this publication still tends to rock the Euro. The volume of sales stalled last month, and is now expected to resume the rises. A 0.3% rise is expected.


EUR/USD Technical Analysis

The Euro started the week in a weak tone, dropping to the 1.2610 support line mentioned in last week’s outlook. It later gradually recovered, managed to cross the 1.2722 line peaked just under 1.2780 before closing at 1.2760. All in all, the Euro rose 60 pips after a tight week of range trading.

The current range is between the important 1.2722 support line and the minor 1.2780 line that capped the pair in the past week. Higher, the 1.2930 that was a stubborn resistance line in recent weeks provides further resistance.

Above, the round number of 1.30 is the next line of resistance, mostly due to its psychological role. Higher, the 1.3110 line served as a line of resistance and later as support during July, and is now a strong barrier. Even higher, 1.3267 is the next resistance line, working as a support line many times in the past.

It’s also important to note the long term uptrend line which switched from support to resistance two weeks ago. It will stand between 1.2950 and 1.30 during the week. A break above this diagonal line will be a bullish sign.

Looking down below 1.2722, the next line of resistance is the 1.2610 line which capped the pair in July and worked just now as a strong line of support.

Lower, 1.2460 held the pair when it was trading lower, in May and in June. Below, the “Lehman levels” – lows of 2008, continue to provide minor support.

A strong line of support appears at 1.2150, which worked as a very strong line of support, and briefly as resistance. Lower, the round number of 1.20 is the next line of support, before the year-to-date low of 1.1876.

I remain bearish on EUR/USD.

The gloomy mood in the markets is still strong, and a double dip recession in the US can hurt the Euro. Also the Euro zone is vulnerable to the austerity measures taken by the member countries. After range trading in these summer days, the new month’s figures, with the Non-Farm Payrolls, can provide significant price action.

GBP/USD Weekly Technical Forecast (Aug 30-Sep 03)


The upcoming week is packed with events, with PMI figures in the limelight. Here’s an outlook for the British events, and an updated technical analysis for GBP/USD.

GBP/USD daily chart with support and resistance lines marked. Click to enlarge:

GBP USD forecast

The Pound dived lower in the past week, but managed to recover, with a boost coming from an upwards revision of GDP for the second quarter. Will it continue higher?

  1. Halifax HPI: Publication time unknown at the moment. This house price index, is one of the most accurate available, as it’s based on internal data from HBOS, one of the biggest banks in the UK. According to the bank, a three month slump in house prices stopped last month with a neat 0.6% rise. A smaller rise is expected this time.

  2. GfK Consumer Confidence: Published on Monday at 23:00 GMT. 2000 consumers are surveyed by GfK for this important survey. After reaching minus 14 points, confidence deteriorated steadily back to minus 22, the worst in 11 months. Another dip is expected now, with the number dropping to minus 23.

  3. Net Lending to Individuals: Published on Tuesday at 8:30 GMT. Borrowing by individuals is necessary to boost the economy. It unexpectedly dropped last month to 600 million, about half of early expectations, disappointing the Pound. A rise to 700 billion is predicted now.

  4. Manufacturing PMI: Published on Wednesday at 8:30 GMT. This survey of 600 purchasing managers always rocks the Pound. In recent months, it has been quite strong, going hand in hand with the UK’s economic strength. It’s now expected to dip from 57.3 to 57.1 points. Any result will rock the Pound.

  5. Nationwide HPI: Published on Thursday at 6:00 GMT. This figure was delayed from last week. The Nationwide House Prices are considered to be an accurate measure of house prices, even though they’re not the first to publish them. In the past two months, prices disappointed and even unexpectedly fell by 0.5% last month. As other indicators show the same trend, another fall is expected now – by 0.3%.

  6. Construction PMI: Published on Thursday at 8:30 GMT. The construction sector took more time in recovering from the recession, but when it did, this survey of purchasing managers showed very strong results, rising quickly to 58 points. Last month it unexpectedly dropped to 54.1 points, and is now expected to stay at a similar level.

  7. Paul Tucker talks: Starts speaking on Friday at 00:45 GMT, in a conference in Seoul. The BOE Deputy Governor is an influential member of the MPC, and often joins the BoE governor on testimonies in the parliament. He might contribute to the debate about British inflation and the chances of a double dip recession, that currently seems unlikely in Britain.

  8. Services PMI: Published on Friday at 8:30 GMT. The all-important services sector closes the PMI releases for this week. In the past two months, the score came lower than predicted, but managed to remain above the critical 50 point mark, indicating economic expansion. It’s now expected to remain at similar levels to last month’s number – at 53.1 points.


GBP/USD Technical Analysis

The British Pound began the week with a significant downfall, first losing the 1.5520 line and quite quickly the 1.5470 line. Both were mentioned in last week’s outlook. The 1.5470 line turned into tough resistance. This was eventually broken, and the pair closed just above 1.5520, at 1.5536 – Another week of retreat for the Pound.

GBP/USD ranges between 1.5520, which served as tough resistance in April and as support line in February, to 1.5720, which supported the Pound back in 2009. It’s less strong than in previous weeks.

Looking up, 1.5833, which provided support when the year began and later worked as resistance, is the next line. Higher, the psychological round number of 1.60 proved to be a tough barrier in recent weeks and is a strong resistance line.

Higher, 1.6080 is the next minor resistance line, after working as support in January. It’s followed by 1.6270, but that’s quite far at the moment.

Looking down below 1.5520, the next line of support is quite close – 1.5470 – it capped the pair just this week. 1.5350 served as pivotal line in March and April and this week’s attempt to break below it makes it strong again.

Below, 1.5230 was a stubborn resistance line in July and is now a major support line. Lower, 1.5120 will provide further support.

I remain bearish on the Pound.

Softer inflation, a new hesitation in job growth,makes the Pound vulnerable in the face of the imminent global slowdown.

EUR/JPY Elliot Wave Weekly Forecast and Trade(Aug 30- Sep 03)

EUR/JPY – 107.65

EUR/JPY: Rebound from 112.08 to 139.26 is wave (B) and wave (C) is unfolding

The single currency has resumed recent downtrend as suggested in our previous update and although price has recovered after falling to 105.44 earlier this week, upside should be limited to 109.00/10 and bring another decline later. Break of said support would extend decline in wave iii for weakness to 104.42 (50% projection of 127.95 to 107.30 measuring from 114.74) and possibly 103.00 but price should stay well above 101.98 (61.8% projection).

The daily chart is labeled as attached, early selloff from 169.97 (July 2008) to 112.08 is wave (A) of B instead of end of entire wave B and then the rebound from there to 139.26 is wave (B), hence, wave C has commended from there with minor wave 1 ended at 119.66 and wave 2 at 127.95 and wave 3 is unfolding and may extend eventual weakness towards 104.42 (50% projection of 127.95 to 107.30 measuring from 114.74).

To recap this wave C from 139.26 is sub-divided into (a): 127.00, (b) 138.49 and wave (c) has commenced from there with a diagonal wave 1 (i: 126.95, ii: 134.37, iii: 120.70, iv: 125.24 and then wave v at 119.66). The rebound from 119.66 to 127.95 was an a-b-c wave 2 and wave 3 is taking place from 127.95 with minor wave i ended at 110.49, followed by wave ii ended at 122.29.

On the upside, only above 110.00/10 would defer and risk retracement to 111.00/10 but reckon 112.03 (previous support turned resistance) should hold, bring another decline. Only break of later resistance would suggest a temporary low has possibly been formed and risk retracement to 113.00 and possibly test of resistance at 114.19 and 114.74.

Recommendation: Sell at 109.00 for 106.00 with stop above 110.20.

To re-cap the corrective upmove from the record low of 88.93 (18 Oct 2000), the wave A from there is subdivided as: 1:88.93-113.72, 2:99.88 (1 Jun 2001), 3:140.91 (30 May 2003), 4:124.17 (10 Nov 2003) and 5 ended at record high of 169.97 (21 Jul 2008). The brief but sharp selloff to 112.08 is viewed as a-b-c x a-b-c wave (A) of B. The subsequent rebound to 139.26 is (B) of B and (C) of (B) is underway which should be limited to 100.00.


The long-term downtrend started from calculated price of 359.26 (Dec 1979). The sharp fall from there to 226.60 (Aug 1981) with impulsive structure is labeled as wave I and wave II was capped at 256.59 (Nov 1982). Wave III decline was contained at 140.58 (Feb 1989), the subsequent rebound to 198.59 (Aug 1990) is seen as wave IV, the subsequent 5-wavers decline from there finished at 88.93 (18 Oct 2000). The strong rebound from there to 169.97 (21 Jul 2008) is tentatively viewed as wave A and wave B selloff was followed and may extend to 105.00. Our alternate count is that entire wave IV correction already ended at 169.97, hence fall to 112.08 would be treated as the wave 1 of V.

AUD/USD Weekly Technical Forecast (Aug 30-Sep 03)


A very busy week expects Aussie traders, with GDP and 12 other events to rock the currency, that still shakes by the election results. Here’s an outlook for the Australian events and an updated technical analysis for AUD/USD.

AUD/USD daily chart with support and resistance lines marked. Click to enlarge:

aud usd forecast

The elections ended in a hung parliament. This political uncertainty, together with weak private capital expenditure, hurt the Australian dollar. The echoes from the elections – whether a government is formed or new elections are called, will continue affecting the Aussie, alongside the many indicators, and also Bernanke’s speech in Jackson Hole. Let’s start:

  1. HIA New Home Sales: Publication time unknown at the moment. The Australian Housing Association releases a rather early report on the prices of homes, but the exact timing is unknown. In the past two months, sales have dropped sharply: 6.4% and 5.1%. A small correction is expected this time in this volatile indicator.

  2. Company Operating Profits: Published on Monday at 1:30 GMT. This quarterly figure has risen in the past two quarters showing that Australian corporations are enjoying the fruits of the economic situation. Following the surprising rise of 3.9% in Q1, Q2 is expected to be even better, with a 5.9% rise.

  3. Guy Debelle talks: Starts speaking on Monday at 23:30 GMT. The RBA Assistant Governor is an influential member of the central bank. In his speech in Sydney, Debelle might hint about future moves regarding the interest rate that has stalled in recent months, after reaching 4.50%.

  4. Retail Sales: Published on Tuesday at 1:30 GMT. This is the most important release that will be simultaneously released with three other indicators (details below). Consumer have been more careful in the past two months – retail sales rose by only 0.2% in these two months. A stronger rise in sales is expected now – 0.4%.

  5. Building Approvals: Published on Tuesday at 1:30 GMT. The housing sector has been a “victim” of rate hikes. The higher costs slowed this sector significantly with three disappointing drops. Last month’s 3.3% fall will probably be followed by a more modest slide this time – 0.6%.

  6. Current Account: Published on Tuesday at 1:30 GMT. On one hand, this is a late figure, released after after the more up-to-date related trade balance figure, but on the other hand it’s a more comprehensive quarterly figure also tends to shake the Aussie. The deficit has stabilized around 17 billion in the past three quarters, and is now expected to drop to only 6.3 billion, helping the Aussie.

  7. Private Sector Credit: Published on Tuesday at 1:30 GMT. Credit is correlated directly with consumer spending, and in this case, complements the retail sales figure released at the same time. Lending growth rose slowly last month – 0.2%, and is now expected to accelerate to 0.3%.

  8. AIG Manufacturing Index: Published on Tuesday at 23:30 GMT. The Australian Industry Group showed good growth in the manufacturing sector last month, with a rise to 54.4 points, significantly above the 50 point score that is the pivotal line between growth and contraction.

  9. Chinese Manufacturing PMI: Published on Wednesday at 1:00 GMT. China is Australia’s main trade partner, and high demand in China is one of the things that helped Australia avoid a recession. Purchasing managers in China showed a slowdown in the manufacturing sector – a drop from 52.1 to 51.2 points. This time, the survey of 700 purchasing managers is expected to rise to 51.5 points. A drop under 50 (meaning contraction) will hurt the Aussie.

  10. GDP: Published on Wednesday at 1:30 GMT. After a strong fourth quarter (+1.1%), Australia’s GDP disappointed in Q1 of 2010 by rising only by 0.5%. Given the strong job market and the overall health of the economy, a growth rate of 0.9% is expected now. Any result will shake the Aussie. This is the main event of the week.

  11. Commodity Prices:  Published on Wednesday at 6:30 GMT. Australia’s economy is highly dependent on exports of commodities, mostly iron and gold. This year-over-year indicator showed a rise of 51% in prices. A similar figure is expected now.

  12. Trade Balance: Published on Thursday at 1:30 GMT. Contrary to the wider current account indicator, this monthly balance of goods has been positive in the past three months. Australia’s surplus rose to 3.54 billion in June, and is now expected to edge down to 3.11 billion.

  13. AIG Services Index: Published on Thursday at 23:30 GMT. According to AIG, the services sector is currently contracting – the score is under 50 points for three straight months. This survey of 200 companies is expected to remain around last month’s figure – 46.6.


AUD/USD Technical Analysis

After the Aussie started lower on a weekend gap, it manged to climb towards 0.90 (mentioned in last week’s outlook), but political uncertainty sent it down again, below the 0.8870 line. A late recovery sent the Aussie to close at 0.8986.

The Aussie now trades between the round psychological number of 0.90 that capped it in the past week, and 0.8870, which is now only a minor support line.

Below, 0.8710, which was a swing low a few months ago is the next line of support. It’s followed by the veteran 0.8567 support line, which began its role back in 2009.

Lower, the double bottom in July, 0.8316, serves as the next support line. Even lower, the year-to-date low of 0.8066 is the ultimate support line.

Looking up above 0.90, the next line is 0.9080 which capped the pair in July and in mid-August. Higher, 0.9135 supported the pair in April and now works as resistance.

Above, 0.9220 was also a support line in April and held the pair a few weeks ago. Even higher, 0.9327 began its role in autumn 2009 and capped the pair many times since then.

I return to being bullish on the Aussie.

The dust from the elections has settled. It seems that a government will be eventually formed. The Australian economy is doing quite well, and the influx of fresh data should support rises.